

Release Date :
Reference Number :
2024-SR22-067
sq.m. – square meters
Php ‘000 – in thousand pesos
p - preliminary; r- revised
* - excluding alteration and repair, and other non-residential
Note: Details of floor area and value may not add up to their respective totals due to rounding
Source: Philippine Statistics Authority
Number of Constructions of Cebu Province (Including HUCs)
1. Number of Constructions Decreased
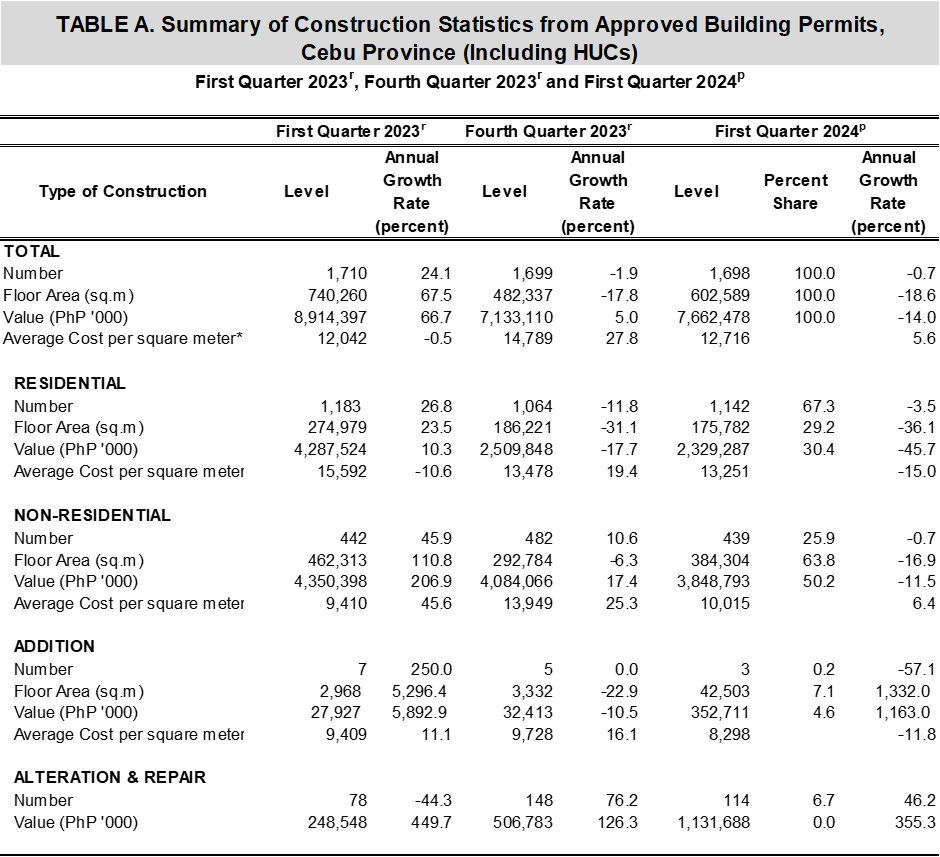
The number of constructions from approved building permits in the first quarter of 2024 was posted at 1, 698 indicating an annual decrease of 0.7 percent from the 1, 710 total number of constructions in the same quarter of the previous year. (Table A)
2. Residential Buildings still had the Highest Number of Construction
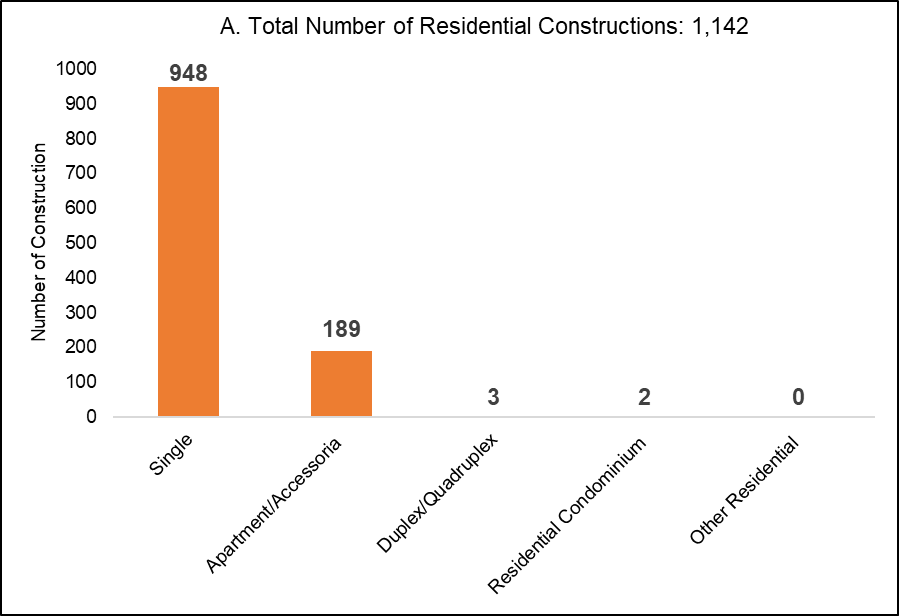
By type of construction, residential buildings reported the highest number of constructions of 1, 142 or 67.3 percent of the total number of constructions during the quarter. This type of construction decelerated at a rate of 3.5 percent of the same quarter of the previous year. Majority of the total residential constructions were single-type houses. (Figure 1a and Table 1)
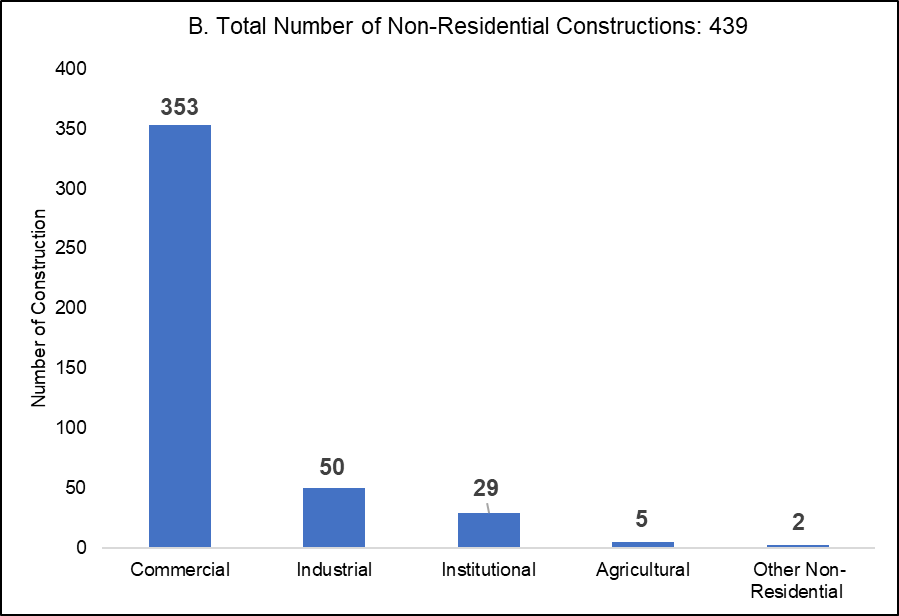
Non-residential type of construction ranked second with 439 or 25.9 percent of the total number of constructions during the quarter. This number indicates a decrease of 0.7 percent in the same period of the previous year. About 80.4 percent of the non-residential constructions were commercial buildings. (Figure 1B and Table 1)
Figure 1: Number of Constructions from Approved Building Permit by Type, Cebu Province (Including HUCs)
p – preliminary
Source: Philippine Statistics Authority
p – preliminary
Source: Philippine Statistics Authority
Addition, which refers to any new construction that increases the height or area of an existing building/structure, and Alteration and Repair of existing structures, shared a 0.2 percent and 6.7 percent to the total number of constructions, respectively. Compared with their respective annual rates in the same period of the previous year,
Addition decelerated at a rate of 57.1 percent while alteration and repair accelerated by 46.2 percent. (Table 1)
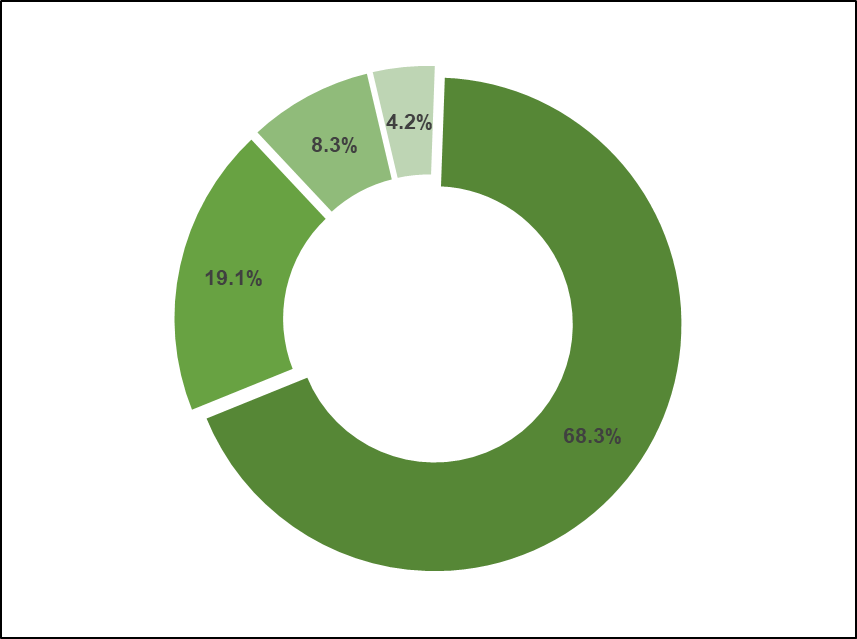
3. Number of Constructions was Highest in the Province of Cebu (Excluding HUCs)
Of the total constructions in the Province of Cebu, Cebu registered the highest number of constructions with 1,160 (68.3% share) during the quarter. It was followed by City of Cebu with 325 (19.1% share), City of Lapu-lapu with 141 (8.3% share), and City of Mandaue with 72 (4.2% share). (Figure 2)
p – preliminary
Source: Philippine Statistics Authority
*excluding HUCs
Value of Constructions of Cebu Province (Including HUCs)
1. Total Value of Constructions Increased
In the first quarter of 2024, the total value of constructions was PhP7.67 billion, which translates to an annual decrease of 14.0 percent. Compared with the previous quarter, it expanded from PhP7.13 billion to PhP7.67 billion or a 7.42 percent increase. (Table A)
2. Non- Residential Type Recorded the Highest Value of Construction
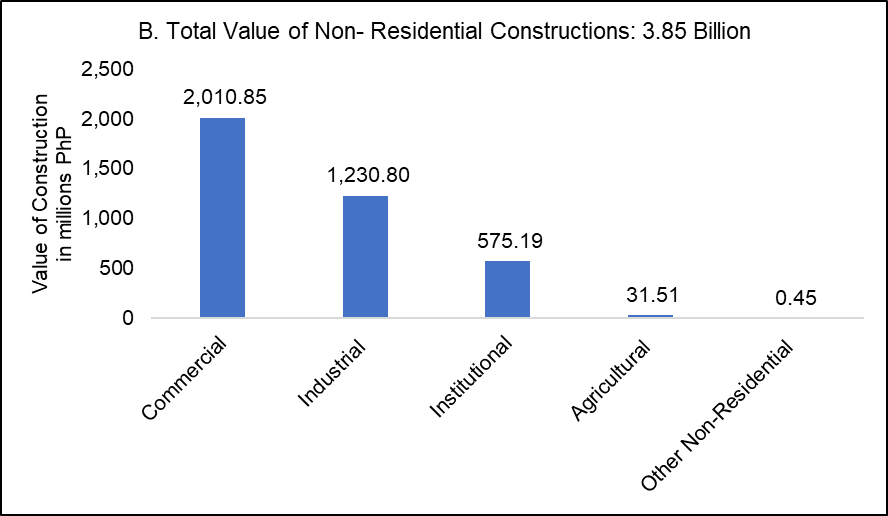
Non-Residential building constructions, valued at PhP3.85 billion accounted for 50.2 percent of the total value of constructions of the period. This amount decelerated by 11.5 percent from the PhP4.35 billion total construction value in the same quarter of 2023. (Figure 3B and Table A)
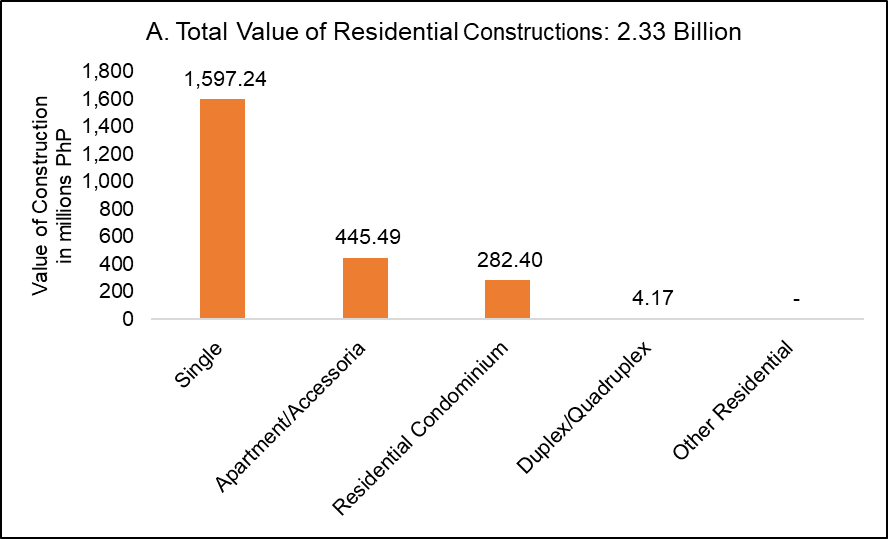
The value of residential constructions, which amounted to PhP2.33 billion, accounted for 30.4 percent of the total value during the quarter. This reflects a 45.7 percent decreased from the PhP4.29 billion value of residential construction in the same quarter of 2023. (Figure 3A and Table A)
Figure 3: Value of Constructions from Approved Building Permit by Type, Cebu Province (Including HUCs): First Quarter 2024p
p – preliminary
Source: Philippine Statistics Authority
p – preliminary
Source: Philippine Statistics Authority
For this first quarter of 2024, the value of construction for addition, alteration, and repair to existing structures amounted to Php352.71 million (4.6 percent share) and Php1.13 billion (14.8 percent share), respectively. The value of construction for addition expanded at an annual rate of 1,163 percent from the recorded PhP27.93 million construction value for the same quarter of last year while the value for alteration and repair to existing structures expanded at an annual rate of 355.3 percent from the Php248.55 million construction value from the same period of last year. (Table A)
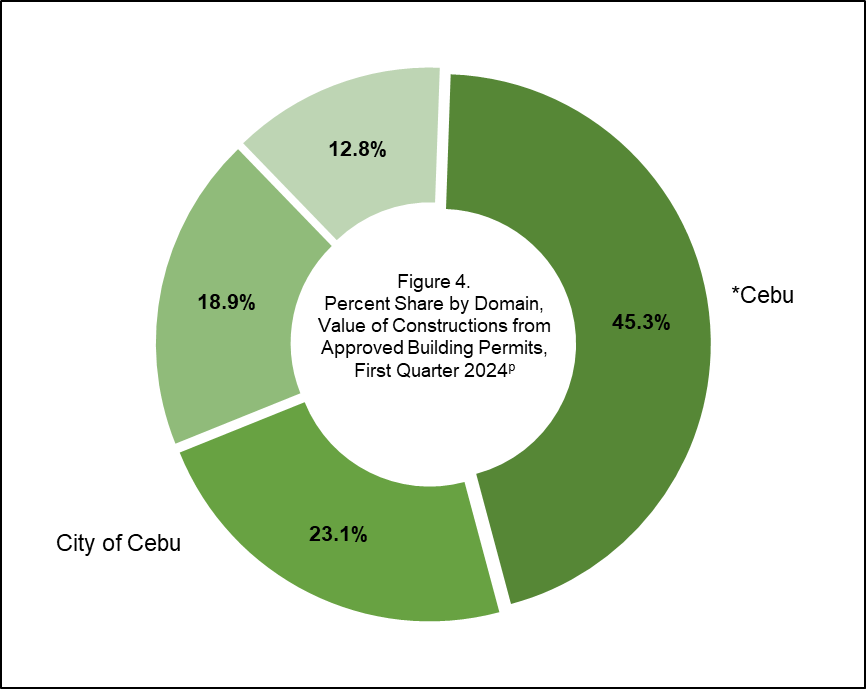
Of the PhP7.7 billion value of construction recorded in Cebu Province, Cebu got the highest contribution with PhP3.5 billion or 45.3 percent of the total. The City of Cebu followed this with PhP1.8 billion or a 23.1 percent share, the City of Lapu-Lapu with PhP1.4 billion or an 18.9 percent share, and the City of Mandaue with PhP1.0 million or a 12.8 percent share.
p – preliminary
Source: Philippine Statistics Authority
*excluding HUCs
Floor Area of Cebu Province (Including HUCs)
1. Reported Total Floor Area of Constructions Decreased
This quarter's total floor area of construction was registered at 602,589 square meters. This translates to an 18.6 percent decrease from the 740,260 square meters of total floor area of the same period of last year. (Table A)
2. Non-residential type accounted for more than half of the Province’s Total Floor Area of Construction
Non-residential constructions recorded 384,304 square meters or 63.8% percent of the total floor area of constructions during the quarter. This translates to a decrease of 16.9 percent from the 462,313 square meters of total floor area of the same period last year. (Table A)
Meanwhile, residential constructions recorded 175,782 square meters, or 29.2 percent of the total floor area of constructions this year. This translates to a decrease of 36.1 percent from the 274,979 square meters of total floor area of the same period last year. (Table A)
Average Cost per Square Meter of Cebu Province (Including HUCs)
1. Average cost of construction expanded
The average cost of construction in the first quarter of 2024, excluding those for alteration and repair, and other non-residential, was recorded at PhP12,716 per square meter. It slightly increased at an annual rate of 5.6 percent compared with the average cost of PhP12,042 in the first quarter of 2023. (Table 1)
2. Residential Construction had the highest average cost of construction
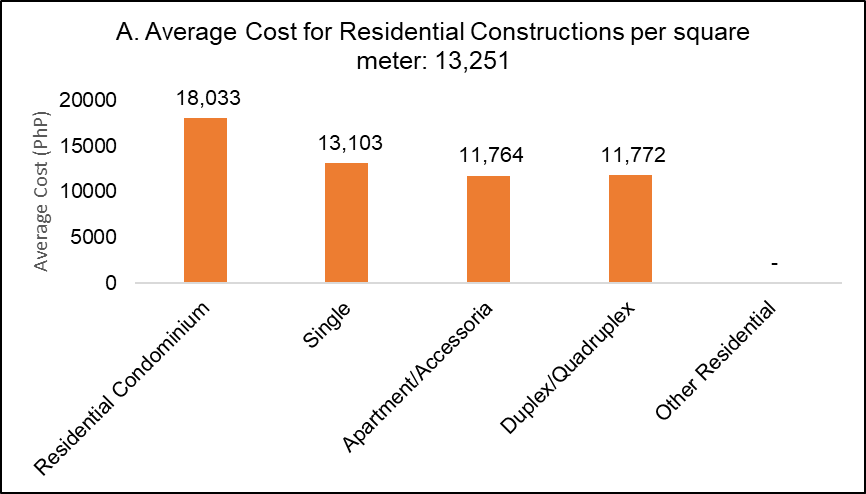
Among types of construction, residential buildings had the highest average cost of PhP13,251 per square meter during the quarter. This was followed by non-residential buildings with PhP10,015 per square meter and addition to existing structures with PhP8,298 per square meter. (Table A)
3. Residential condominium construction was the most expensive among types of residential construction
Among residential constructions, residential condominiums posted the highest average cost of PhP18,033 per square meter during the quarter, while other residential recorded zero in the first quarter of 2024. (Figure 5A and Table A)
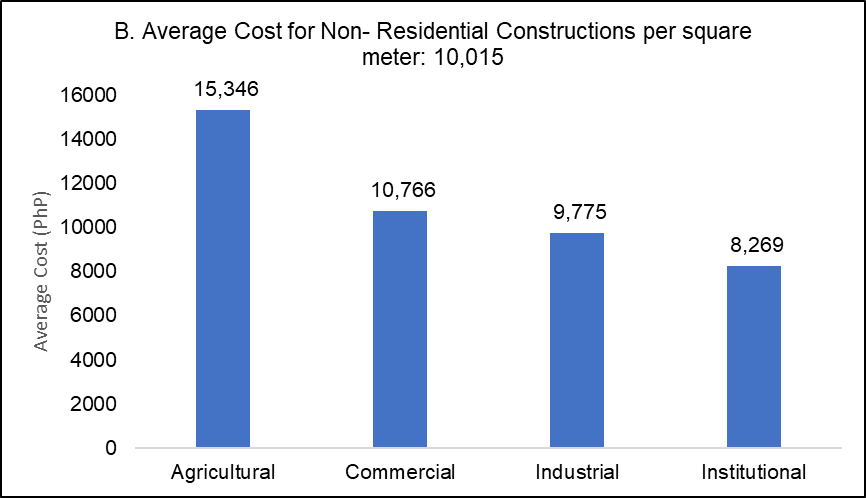
4. Agricultural-type buildings had the highest cost among non-residential constructions
For this quarter, Agricultural-type building constructions reported the highest average cost of PhP15,346 per square meter. On the other hand, institutional-type buildings registered the lowest average cost of PhP8,269 per square meter. (Figure 5B and Table A)
Figure 5: Average Cost of Constructions from Approved Building Permit by Type, Cebu Province (Including HUCs): First Quarter 2024p
p – preliminary
Source: Philippine Statistics Authority
p – preliminary
Source: Philippine Statistics Authority
Prepared by:
SGD
ROSEMARY Y. NIALA
Statistical Analyst
Approved by:
SGD
MELCHOR B. BAUTISTA
Chief Statistical Specialist
| Attachment | Size |
|---|---|
|
|
4.2 MB |