

Release Date :
Reference Number :
2024-SR07-011
Central Visayas Population in 2020 is relatively young
The region’s population remains relatively young as shown by the broad-based population pyramid in 2020. (Figure 1)
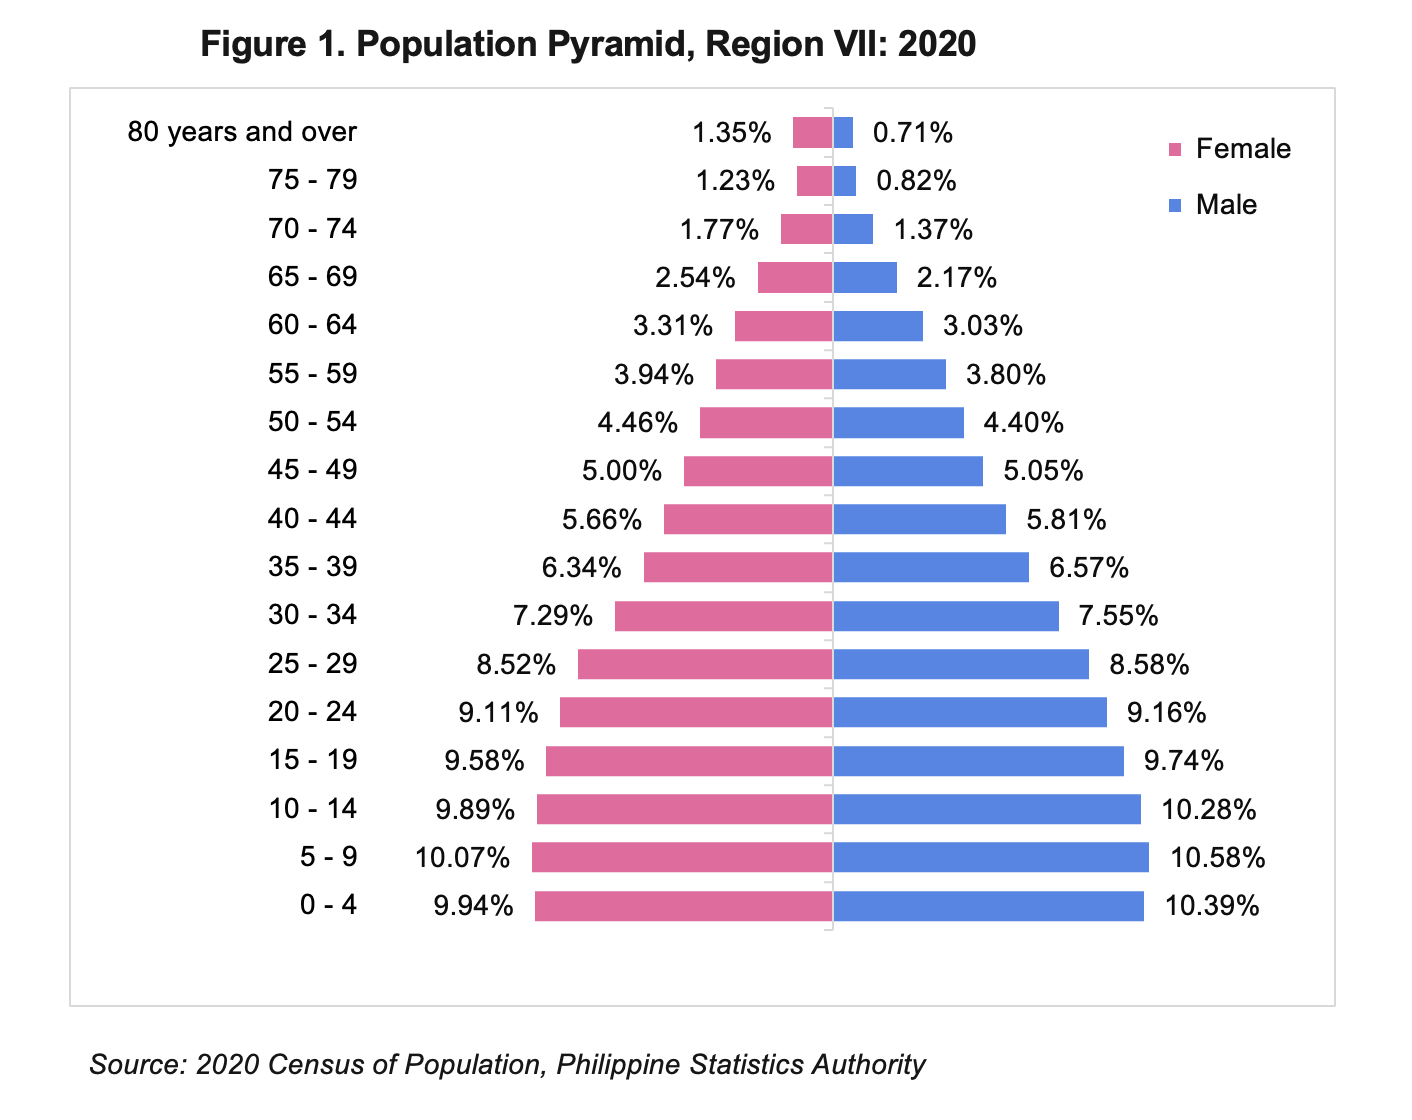
Of the 8.05 million household population in 2020, 4.08 million or 50.7 percent were males while 3.97 million or 49.3 percent were females. By age group, 2.46 million or 30.6 percent were under 15 years of age (young dependents). (Table 1)
On the other hand, persons aged 15 to 64 years (working-age or economically-active population) totaled 5.11 million or 63.5 percent while those in age groups 65 years and over (old dependents) comprised the remaining 479.73 thousand or 6.0 percent.
(Table 1)
Moreover, there were more males (44.7 percent) than females (42.3 percent) among the 0 to 54 age group in 2020. Meanwhile, among the older age group (55 years and over), females (7.0 percent) outnumbered the males (6.0 percent). (Table 1)
Table 1. Household Population and Sex Ratio by Age Group,
Region VII: 2020
Age Group | Women | Men |
| ||
No. | % | No. | % | Sex Ratio | |
REGION VII | 3,965,147 | 49.3 | 4,081,138 | 50.7 | 103 |
0 - 4 | 394,182 | 4.9 | 423,959 | 5.3 | 108 |
5 - 9 | 399,180 | 5.0 | 431,637 | 5.4 | 108 |
10 - 14 | 391,981 | 4.9 | 419,576 | 5.2 | 107 |
15 - 19 | 379,988 | 4.7 | 397,400 | 4.9 | 105 |
20 - 24 | 361,173 | 4.5 | 373,697 | 4.6 | 103 |
25 - 29 | 337,835 | 4.2 | 350,216 | 4.4 | 104 |
30 - 34 | 289,228 | 3.6 | 308,209 | 3.8 | 107 |
35 - 39 | 251,292 | 3.1 | 268,314 | 3.3 | 107 |
40 - 44 | 224,494 | 2.8 | 237,155 | 2.9 | 106 |
45 - 49 | 198,430 | 2.5 | 206,045 | 2.6 | 104 |
50 - 54 | 176,971 | 2.2 | 179,404 | 2.2 | 101 |
55 - 59 | 156,170 | 1.9 | 155,191 | 1.9 | 99 |
60 - 64 | 131,079 | 1.6 | 123,750 | 1.5 | 94 |
65 - 69 | 100,884 | 1.3 | 88,553 | 1.1 | 88 |
70 - 74 | 70,150 | 0.9 | 55,714 | 0.7 | 79 |
75 - 79 | 48,703 | 0.6 | 33,456 | 0.4 | 69 |
80 years and over | 53,407 | 0.7 | 28,862 | 0.4 | 54 |
Source: 2020 Census of Population and Housing, Philippine Statistics Authority
Table 2. Total Population of Youth Aged 15-24 By Sex, Age Group, by Province, Region VII: 2020
Province/Age Group | Women | Men | ||
No. | % | No. | % | |
REGION VII | 741,161 | 49 | 771,097 | 51 |
BOHOL | 124,939 | 9.0 | 134,059 | 9.6 |
15 - 19 | 68,835 | 5.0 | 73,397 | 5.3 |
20 - 24 | 56,104 | 4.0 | 60,662 | 4.4 |
CEBU (excluding CITIES OF CEBU, LAPU-LAPU, and MANDAUE) | 301,163 | 9.1 | 317,644 | 9.6 |
15 - 19 | 155,927 | 4.7 | 165,001 | 5.0 |
20 - 24 | 145,236 | 4.4 | 152,643 | 4.6 |
CITY OF CEBU (Capital) | 94,597 | 9.9 | 93,531 | 9.8 |
15 - 19 | 44,535 | 4.6 | 44,902 | 4.7 |
20 - 24 | 50,062 | 5.2 | 48,629 | 5.1 |
CITY OF LAPU-LAPU (OPON) | 47,431 | 9.6 | 47,213 | 9.5 |
15 - 19 | 22,316 | 4.5 | 22,730 | 4.6 |
20 - 24 | 25,115 | 5.1 | 24,483 | 4.9 |
CITY OF MANDAUE | 35,144 | 9.7 | 35,592 | 9.9 |
15 - 19 | 15,732 | 4.4 | 16,120 | 4.5 |
20 - 24 | 19,412 | 5.4 | 19,472 | 5.4 |
NEGROS ORIENTAL | 129,282 | 9.0 | 133,975 | 9.4 |
15 - 19 | 68,031 | 4.8 | 70,409 | 4.9 |
20 - 24 | 61,251 | 4.3 | 63,566 | 4.4 |
SIQUIJOR | 8,605 | 8.4 | 9,083 | 8.8 |
15 - 19 | 4,612 | 4.5 | 4,841 | 4.7 |
20 - 24 | 3,993 | 3.9 | 4,242 | 4.1 |
Source: 2020 Census of Population, Philippine Statistics Authority
In 2020, there were more men (51.0 percent) than women (49.0 percent) among the youth in the region. Same trend was seen in all provinces except for the City of Cebu and City of Lapu-Lapu where youth women were more than the youth men. (Table 2)
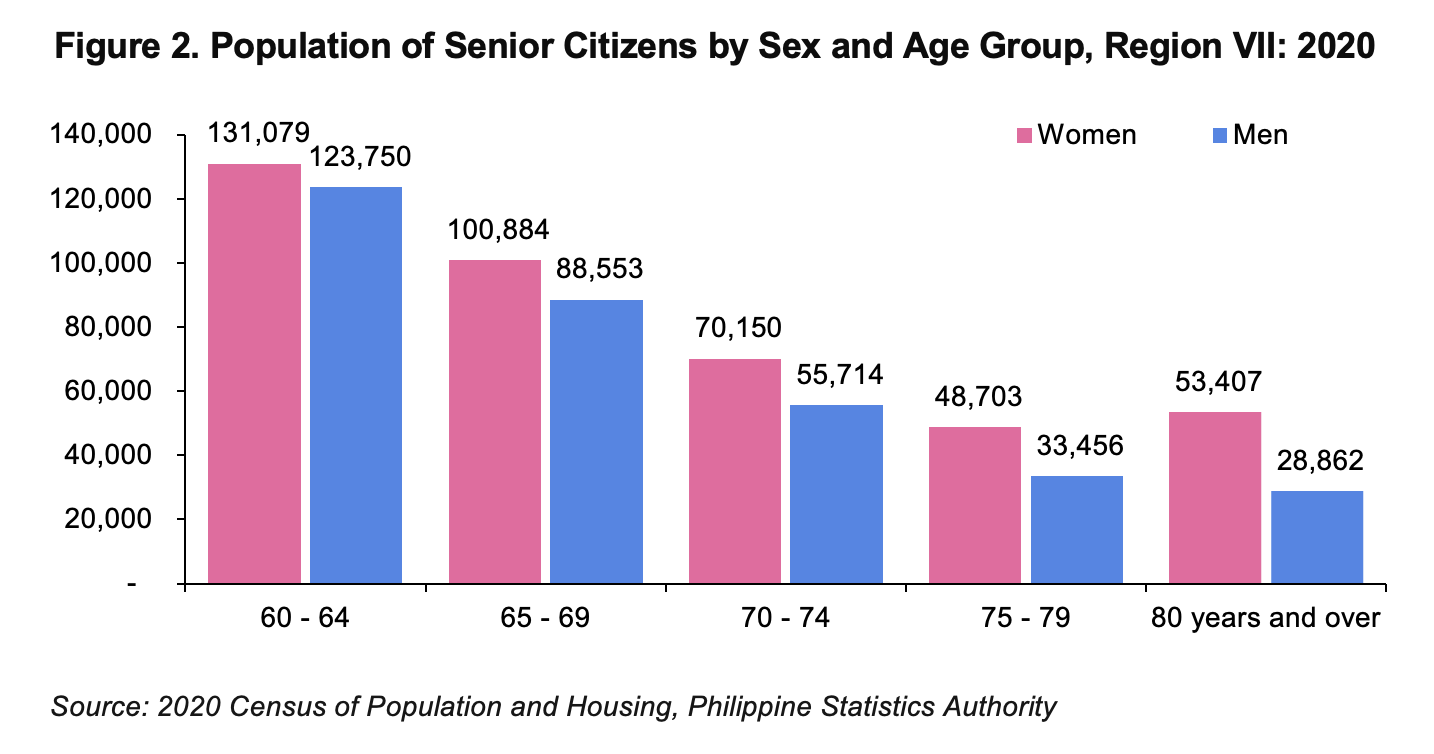
In 2020, more than half or 55.0 percent of the senior citizens in the region were women. In all age groups for senior citizens, population of women were relatively higher than men. (Figure 2)
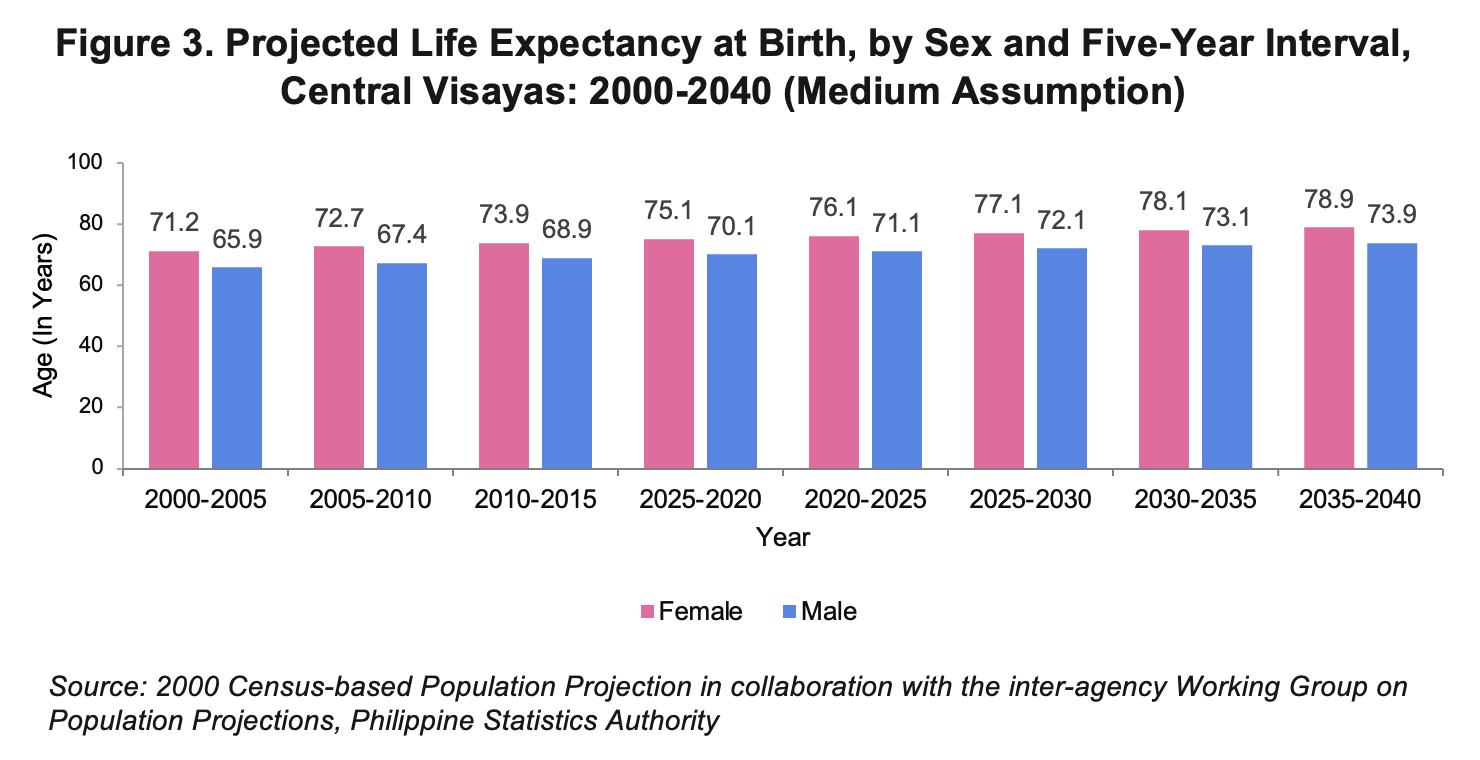
Women live longer than men
Females who are born between 2000 to 2040 are expected to live longer by 5 years than their male counterparts in Central Visayas. The life expectancy at birth for those born at this period is 75.1 years for females and 70.1 years for male. This is projected to improve further in 2035 to 2040 when life expectancy at birth is expected to rise to 78.9 years for females and 73.9 for males. The gap between the projected life expectancy between female and male is expected to narrow down from 5.3 in 2000-2005 to 5.0 in 2035-2040. (Figure 3)
More single men than women in Central Visayas
Of the household population 10 years and over in 2020, there were more single men than women in the region with 54.3 percent and 45.7 percent, respectively. However, women outnumbered men among married, widowed, common-law/live-in, divorced/separated and unknown status population. (Table 3)
Table 3. Household Population 10 Years Old and Over by Age Group, Sex, Marital Status, Region VII: 2020 | |||||||
| |||||||
Sex and Age Group | Household Population | Marital Status | |||||
Single | Married | Common-law / Live-in | Widowed | Divorced/ Separated/ Annulled | Unknown | ||
Male | |||||||
Below 20 | 816,976 | 788,610 | 9,830 | 18,303 | 88 | 122 | 23 |
20 - 24 | 373,697 | 263,366 | 32,353 | 77,051 | 196 | 711 | 20 |
25 - 29 | 350,216 | 145,870 | 90,756 | 111,248 | 413 | 1,906 | 23 |
30 - 34 | 308,209 | 74,354 | 139,890 | 89,789 | 859 | 3,298 | 19 |
35 - 39 | 268,314 | 40,072 | 160,007 | 62,183 | 1,381 | 4,657 | 14 |
40 - 44 | 237,155 | 23,927 | 162,088 | 43,169 | 2,488 | 5,474 | 9 |
45 - 49 | 206,045 | 14,981 | 151,409 | 30,400 | 3,967 | 5,280 | 8 |
50 - 54 | 179,404 | 9,809 | 137,591 | 21,814 | 5,819 | 4,368 | 3 |
55 - 59 | 155,191 | 5,791 | 121,149 | 16,397 | 7,967 | 3,880 | 7 |
60 - 64 | 123,750 | 3,740 | 95,577 | 11,537 | 9,990 | 2,900 | 6 |
65 - 69 | 88,553 | 2,333 | 66,511 | 7,214 | 10,601 | 1,891 | 3 |
70 - 74 | 55,714 | 1,329 | 39,572 | 3,925 | 9,808 | 1,077 | 3 |
75 - 79 | 33,456 | 735 | 21,835 | 2,091 | 8,320 | 472 | 3 |
80 years and over | 28,862 | 801 | 15,038 | 1,650 | 11,075 | 297 | 1 |
Total | 3,225,542 | 1,375,718 | 1,243,606 | 496,771 | 72,972 | 36,333 | 142 |
Female | |||||||
Below 20 | 771,969 | 723,945 | 11,861 | 35,338 | 126 | 656 | 43 |
20 - 24 | 361,173 | 205,789 | 51,463 | 100,888 | 361 | 2,637 | 35 |
25 - 29 | 337,835 | 99,352 | 120,840 | 111,817 | 911 | 4,886 | 29 |
30 - 34 | 289,228 | 46,115 | 156,078 | 78,598 | 1,962 | 6,447 | 28 |
35 - 39 | 251,292 | 24,683 | 163,987 | 51,923 | 3,323 | 7,361 | 15 |
40 - 44 | 224,494 | 15,155 | 159,366 | 36,312 | 5,949 | 7,699 | 13 |
45 - 49 | 198,430 | 10,616 | 146,087 | 25,701 | 9,297 | 6,713 | 16 |
50 - 54 | 176,971 | 8,227 | 129,254 | 18,688 | 15,062 | 5,734 | 6 |
55 - 59 | 156,170 | 6,232 | 109,473 | 13,892 | 21,651 | 4,914 | 8 |
60 - 64 | 131,079 | 5,300 | 83,785 | 9,927 | 28,333 | 3,712 | 22 |
65 - 69 | 100,884 | 3,758 | 56,506 | 6,833 | 31,343 | 2,436 | 8 |
70 - 74 | 70,150 | 2,887 | 31,946 | 4,274 | 29,845 | 1,191 | 7 |
75 - 79 | 48,703 | 2,149 | 17,248 | 2,603 | 26,134 | 564 | 5 |
80 years and over | 53,407 | 2,851 | 11,742 | 2,958 | 35,423 | 417 | 16 |
Total | 3,171,785 | 1,157,059 | 1,249,636 | 499,752 | 209,720 | 55,367 | 251 |
Overall Total | 6,397,327 | 2,532,777 | 2,493,242 | 996,523 | 282,692 | 91,700 | 393 |
Source: 2020 Census of Population and Housing, Philippine Statistics Authority
More women are literate than men in 2019

In 2019, women posted a simple literacy rate of 96.9 percent. This figure is higher compared to that of men at 94.8 percent. Consequently, women had a higher functional literacy rate at 91.0 percent compared to that of men at 87.2 percent. (Figure 4)
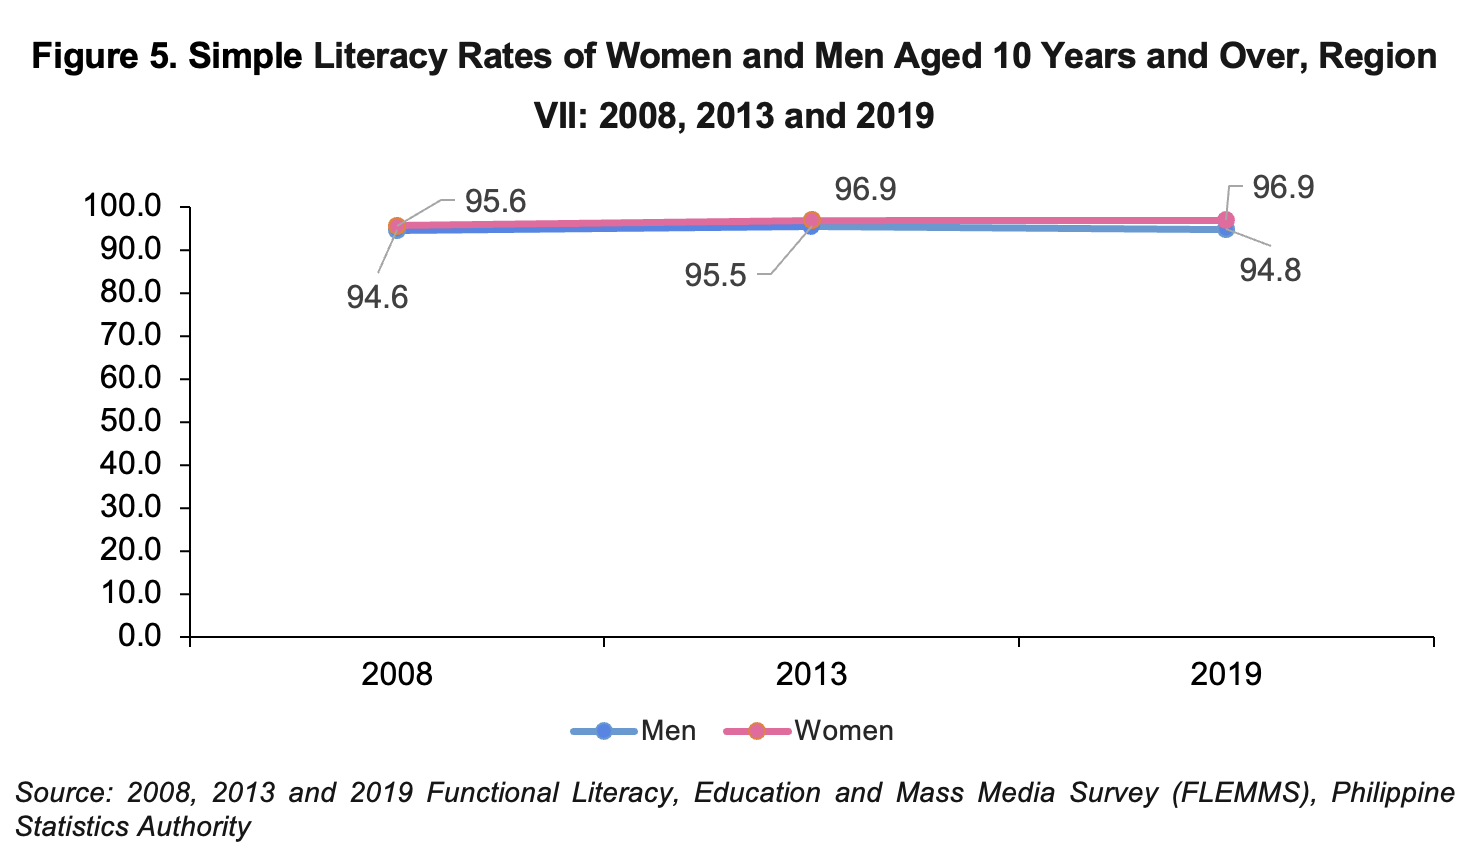
Simple literacy rate among women in Central Visayas increased by 1.31 percentage points while those of men decreased by 0.18 percentage points, respectively, from 2008 to 2019. The literacy rate for women improved from 95.60 percent in 2008 to 96.91 percent in 2019, while the literacy rate for men also increased from 94.60 percent to 94.78 percent in the same period. It can be noted that, however, the literacy rate among women has been consistently higher than men from 2008 to 2019. (Figure 5)
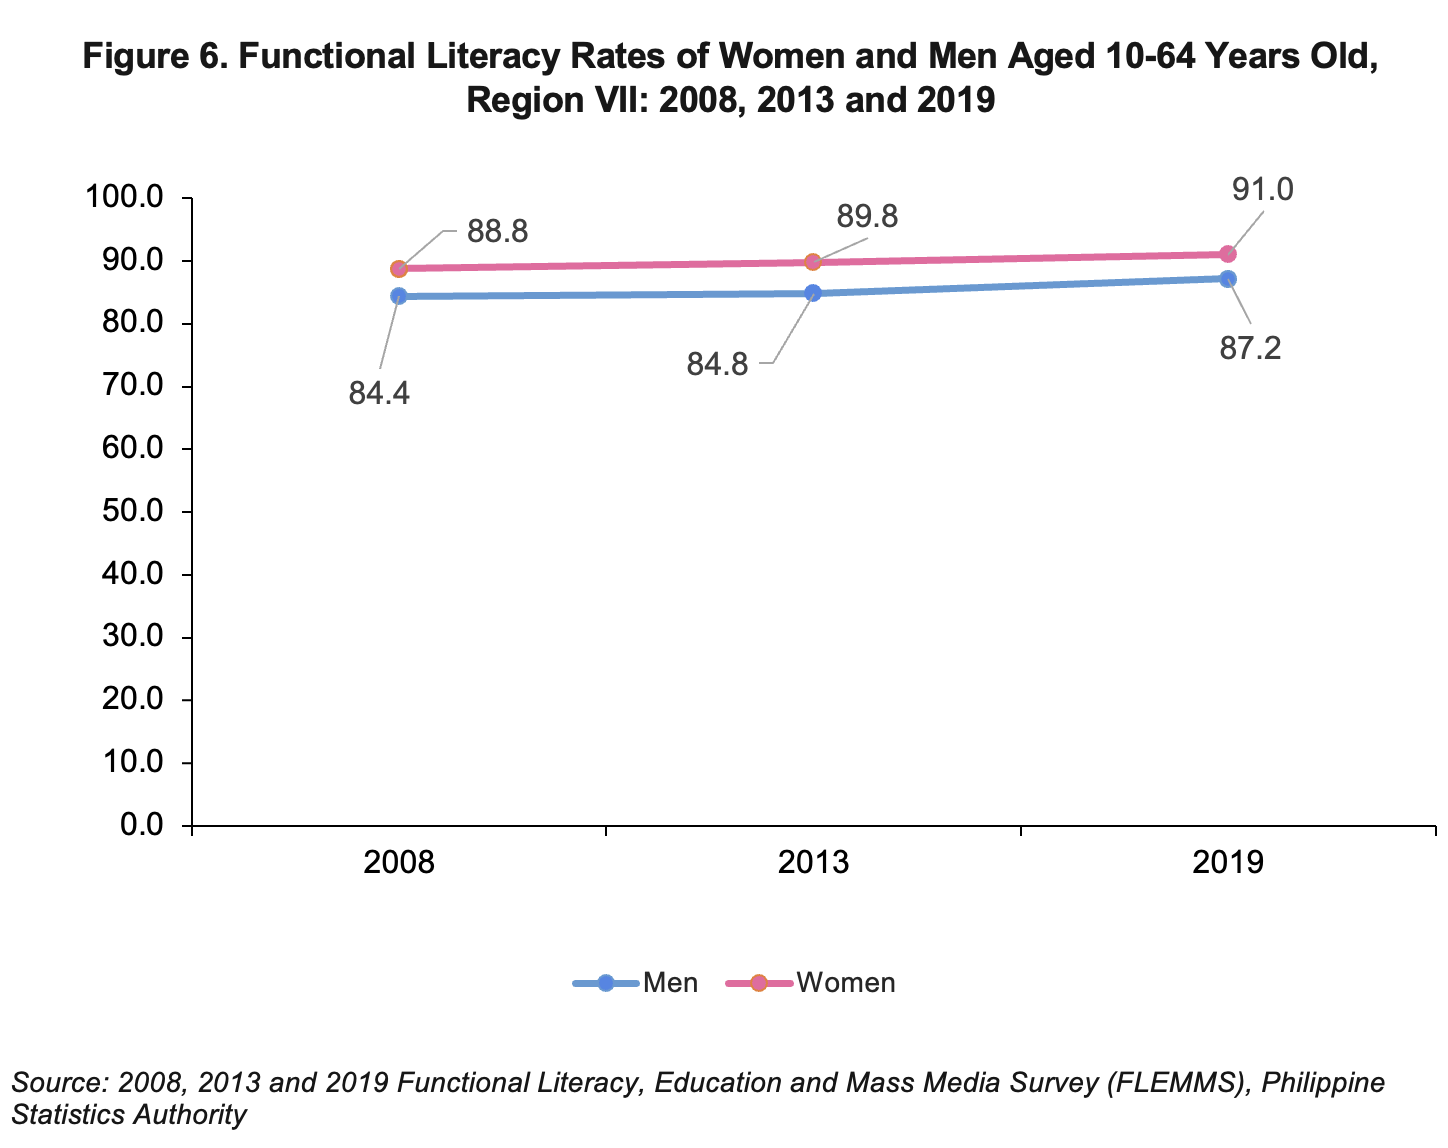
In terms of functional literacy, women in Central Visayas achieved higher functional literacy rate than men from 2008 to 2019. In general, both functional literacy rates of women and men improved from 2008 to 2019. (Figure 6)
Table 4. Basic Literacy Rate of Population 10 Years Old and Over by Sex and Age Group, Region VII: 2008, 2013 and 2019
Year | Population 10 Years and Over | Basic Literacy Rate | ||
(In thousands) | (In percent) | |||
Male | Female | Male | Female | |
2008 | 2,647 | 2,637 | 94.6 | 95.6 |
10 - 14 | 442 | 400 | 95.1 | 97.9 |
15 - 19 | 397 | 410 | 96.7 | 98.8 |
20 - 24 | 292 | 268 | 97.6 | 97.4 |
25 - 29 | 272 | 249 | 96.0 | 97.8 |
30 - 39 | 451 | 459 | 93.5 | 96.4 |
40 - 49 | 346 | 347 | 95.3 | 97.0 |
50 - 59 | 228 | 239 | 94.5 | 93.8 |
60 and over | 218 | 265 | 84.7 | 82.4 |
2013 | 2,841 | 2,814 | 95.5 | 96.9 |
10 - 14 | 384 | 359 | 98.3 | 99.4 |
15 - 19 | 382 | 360 | 99.0 | 99.1 |
20 - 24 | 342 | 329 | 95.7 | 98.8 |
25 - 29 | 294 | 282 | 97.6 | 98.6 |
30 - 39 | 489 | 474 | 94.8 | 97.7 |
40 - 49 | 395 | 385 | 93.6 | 95.6 |
50 - 59 | 287 | 292 | 95.8 | 95.3 |
60 and over | 269 | 333 | 87.3 | 89.7 |
2019 | 3,153 | 3,105 | 94.8 | 96.9 |
10 - 14 | 406 | 383 | 98.3 | 99.4 |
15 - 19 | 382 | 363 | 99.0 | 99.1 |
20 - 24 | 365 | 347 | 95.7 | 98.8 |
25 - 29 | 334 | 315 | 97.6 | 98.6 |
30 - 39 | 572 | 541 | 94.8 | 97.7 |
40 - 49 | 438 | 424 | 93.6 | 95.6 |
50 - 59 | 329 | 331 | 95.8 | 95.3 |
60 and over | 327 | 402 | 87.3 | 89.7 |
Note: The Functional Literacy, Education and Mass Media Survey is conducted every five years
Source: 2008, 2013, and 2019 Functional Literacy, Education and Mass Media Survey (FLEMMS), Philippine Statistics Authority
Generally, basic literacy rates of women by age group in Central Visayas were higher compared to men except the age group of 50-59 in 2008, 2013 and 2019, age group of 60 and over in 2008, and age group of 20-24 in 2008. (Table 4)
Table 5. Functional Literacy Rate of Population 10 to 64 years old by Sex and Age Group, Region VII: 2008, 2013, 2019
Year | Population 10 Years and Over |
| ||
(In thousands) | Functional Literacy Rate | |||
| (In percent) | |||
Male | Female | Male | Female | |
|
|
|
|
|
2008 | 2,499 | 2,449 | 84.4 | 88.8 |
10 - 14 | 442 | 400 | 79.0 | 86.9 |
15 - 19 | 419 | 419 | 90.8 | 91.6 |
20 - 24 | 270 | 259 | 92.3 | 95.6 |
25 - 29 | 260 | 246 | 89.0 | 96.2 |
30 - 39 | 470 | 461 | 81.7 | 89.3 |
40 - 49 | 332 | 347 | 82.3 | 85.5 |
50 - 59 | 236 | 240 | 79.6 | 80.8 |
60 and over | 70 | 77 | 77.1 | 73.5 |
|
|
|
|
|
2013 | 2,667 | 2,585 | 84.8 | 89.8 |
10 - 14 | 384 | 359 | 80.2 | 83.4 |
15 - 19 | 382 | 360 | 90.9 | 95.7 |
20 - 24 | 342 | 329 | 92.3 | 96.3 |
25 - 29 | 294 | 282 | 91.3 | 94.3 |
30 - 39 | 489 | 474 | 82.1 | 90.5 |
40 - 49 | 395 | 385 | 80.9 | 86.8 |
50 - 59 | 287 | 292 | 82.3 | 84.1 |
60 and over | 95 | 103 | 69.4 | 83.2 |
|
|
|
|
|
2019 | 2,946 | 2,833 | 87.2 | 91.0 |
10 - 14 | 719 | 719 | 80.6 | 83.7 |
15 - 19 | 677 | 684 | 92.0 | 95.2 |
20 - 24 | 646 | 656 | 95.8 | 96.7 |
25 - 29 | 591 | 593 | 92.7 | 96.8 |
30 - 39 | 1,013 | 1,018 | 91.1 | 95.8 |
40 - 49 | 776 | 798 | 86.2 | 90.5 |
50 - 59 | 583 | 623 | 72.6 | 81.7 |
60 and over | 213 | 244 | 76.8 | 76.2 |
Note: The Functional Literacy, Education and Mass Media Survey is conducted every five years
Source: 2008, 2013 and 2019 Functional Literacy, Education and Mass Media Survey (FLEMMS), Philippine Statistics Authority
Functional literacy rates of women by age group in Central Visayas were higher than that of men except for age group 60 and over in 2008 and 2019. In 2013, women functional literacy rates were higher at all age groups compared to men. Functional literacy rate of women at age group 25 – 29 was the highest among women age groups at 96.8 percent in 2019. Furthermore, age group 20-24 among men recorded the highest functional literacy at 95.8 percent in 2019. (Table 5)
More men were enrolled in basic public schools, but more female enrolled in basic private schools of Central Visayas in S.Y. 2021-2022
Table 6. Enrolment in Public Schools by Level of Education, Sex, and Province, Region VII: S.Y. 2021 – 2022
Level of Education/ Province/City | Girls | Boys | ||
No. | % | No. | % | |
Kinder & Elementary |
|
|
|
|
Region VII | 512,649 | 47.62 | 563,874 | 52.38 |
Bohol | 85,131 | 47.62 | 96,640 | 52.38 |
Cebu | 323,203 | 47.75 | 353,715 | 52.25 |
Negros Oriental | 98,570 | 47.84 | 107,472 | 52.16 |
Siquijor | 5,745 | 48.72 | 6,047 | 51.28 |
Secondary (Junior) |
|
|
|
|
Region VII | 275,196 | 48.35 | 294,037 | 51.65 |
Bohol | 44,176 | 47.53 | 48,773 | 52.47 |
Cebu | 176,524 | 48.12 | 190,295 | 51.88 |
Negros Oriental | 51,295 | 49.87 | 51,557 | 50.13 |
Siquijor | 3,201 | 48.40 | 3,412 | 51.6 |
Secondary (Senior) |
|
|
|
|
Region VII | 114,272 | 48.99 | 118,970 | 51.01 |
Bohol | 23,754 | 48.58 | 25,144 | 51.42 |
Cebu | 65,783 | 48.01 | 71,227 | 51.99 |
Negros Oriental | 23,340 | 52.63 | 21,011 | 47.37 |
Siquijor | 1,395 | 46.77 | 1,588 | 53.23 |
Source: Department of Education VII
There were more males than females enrolled in public kindergarten and elementary, junior secondary, and senior secondary schools in the region during S.Y. 2021-2022. However, when looking at the provinces in the region, it can be noted that there were more females than males enrolled in public senior secondary schools in Negros Oriental of the same school year. (Table 6)
Table 7. Enrolment in Private Schools by Level of Education, Sex and Province, Region VII: S.Y. 2021 – 2022
Level of Education/ Province/City | Girls | Boys | ||
No. | % | No. | % | |
Kinder & Elementary |
|
|
|
|
Region VII | 37,790 | 48.50 | 40,135 | 51.50 |
Bohol | 5,692 | 48.36 | 6,078 | 51.64 |
Cebu | 28,034 | 48.66 | 29,580 | 51.34 |
Negros Oriental | 3,781 | 47.43 | 4,191 | 52.57 |
Siquijor | 283 | 49.74 | 286 | 50.26 |
Secondary (Junior) |
|
|
|
|
Region VII | 43,205 | 50.11 | 43,008 | 49.89 |
Bohol | 10,096 | 48.38 | 10,772 | 51.62 |
Cebu | 28,644 | 50.80 | 27,742 | 49.20 |
Negros Oriental | 4,212 | 50.30 | 4,162 | 49.70 |
Siquijor | 253 | 43.25 | 332 | 56.75 |
Secondary (Senior) |
|
|
|
|
Region VII | 58,947 | 54.19 | 49,827 | 45.81 |
Bohol | 7,374 | 50.97 | 7,092 | 49.03 |
Cebu | 46,490 | 54.80 | 38,340 | 45.20 |
Negros Oriental | 4,817 | 54.40 | 4,037 | 45.60 |
Siquijor | 266 | 42.63 | 358 | 57.37 |
Source: Department of Education VII
There were more females than males enrolled in private junior and senior secondary schools in the region during S.Y. 2021-2022. However, there were more males enrolled in private kindergarten and elementary schools than females in the same school year. (Table 7)
Economic Participation of currently married women in Central Visayas have significantly increased over time
Table 8. Percent Distribution of Current Married Women Aged 15-49 who Earned Cash in the past 12 months, by the Person who Decides how Earnings are Used, Region VII: 2003, 2008, 2013, and 2022
Person who decides how earnings are used | |||||||
| Self only/ Mainly |
| Mainly husband |
|
|
| No. of Women Respondents |
Year | wife | Jointly | Other | Missing | Total | ||
2003 | 68.0 | 28.8 | 2.7 | 0.5 | 0.0 | 100 | 399 |
2008 | 42.8 | 51.9 | 5.3 | 0.0 | 0.0 | 100 | 306 |
2013 | 45.9 | 50.5 | 2.7 | 0.0 | 0.8 | 100 | 392 |
2017 | 54.0 | 44.0 | 2.0 | 0.0 | 0.0 | 100 | 504 |
2022 | 55.4 | 41.0 | 3.5 | 0.0 | 0.0 | 100 | 601 |
Note: Details may not add up to totals due to rounding
Source: National Demographic and Health Survey (NDHS), Philippine Statistics Authority
In 2022, the percentage of married women in Central Visayas who decide jointly with their husband or partner on how earnings are to be used decreased to 41.0 percent from 44.0 percent in 2017, while those who decide solely by themselves increased to 55.4 percent from 54.0 percent in 2017. (Table 8)
Approved by:
ARIEL E. FLORENDO
Regional Director
| Attachment | Size |
|---|---|
|
|
924.72 KB |