Starting February 2022, the Philippine Statistics Authority (PSA) released the rebased Consumer Price Index (CPI) for all income households to base year 2018, from base year 2012 as announced in the press release number 2022-01 dated 04 January 2022. The CPI series for all income households for January 2022 onwards will be 2018-based.
A. The Philippines
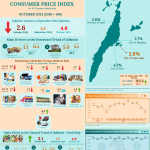
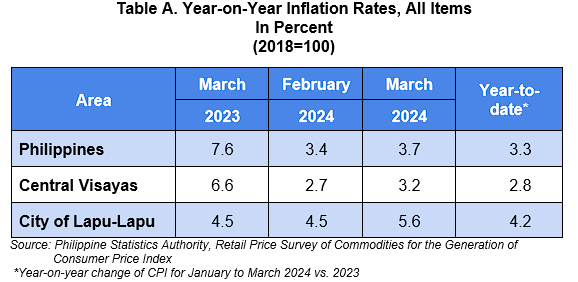
The Philippines’ headline inflation or the overall inflation increased to 3.7 percent in March 2024 from 3.4 percent in February 2024. This brings the national average inflation from January 2024 to March 2024 at 3.3 percent. In March 2023, inflation rate was higher at 7.6 percent. (Table A)
B. Central Visayas
1. Regional Inflation
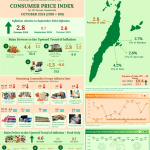
Following the trend at the national level, headline inflation rate in Central Visayas also increased to 3.2 percent in March 2024 from 2.7 percent in February 2024. The region’s average inflation from January to March 2024 stood at 2.8 percent. In March 2023, the inflation rate in the region was higher which recorded at 6.6 percent. (Table A)
C. City of Lapu-Lapu
1. Headline Inflation
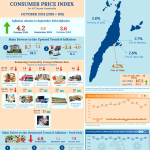
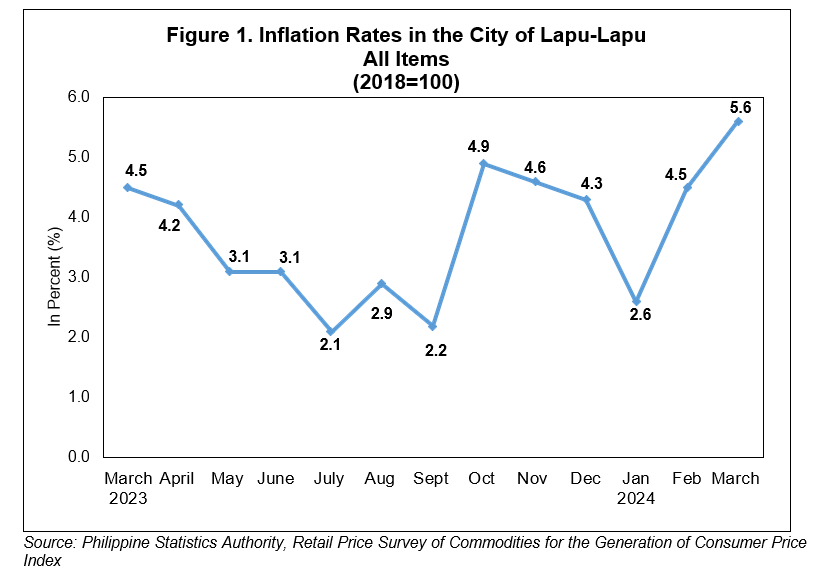
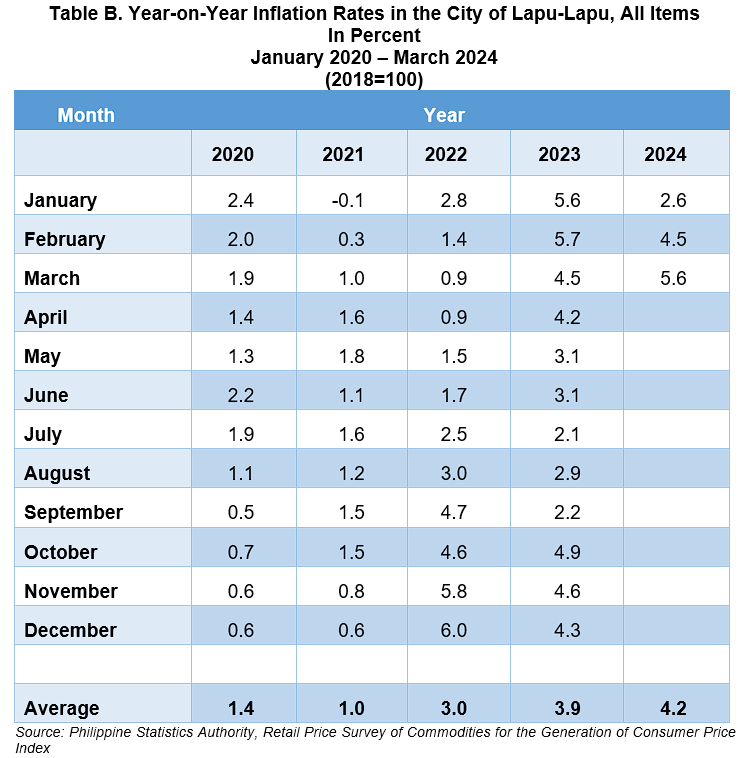
Lapu-Lapu City’s headline inflation rate increased to 5.6 percent in March 2024 from 4.5 percent in February 2024. This brings the city’s average inflation from January to March 2024 at 4.2 percent. In March 2023, the inflation rate in the city was posted at 4.5 percent. (Table A and Figure 1).
1.1 Main Drivers to the Upward Trend of the Headline Inflation
The upward trend of the headline inflation in February 2024 in the city was primarily influenced by the higher growth rate in the heavily-weighted food and non-alcoholic beverages commodity group at 6.8 percent during the month from 4.6 percent in February 2024. Restaurants and accommodation services index at 18.9 percent in March 2024 from 18.2 percent in the previous month. (Table 3, All Income)
Slower annual decrease was also noted in housing, water, electricity, gas and other fuels commodity group at 0.3 percent in March 2024 from 0.7 percent annual decline in the previous month.
In addition, other commodity groups that registered higher inflation rates during the month were as follows:
a. Clothing and footwear, 6.6 percent from 6.5 percent;
b. Transport, 3.3 percent from 2.3 percent;
c. Health, 4.2 percent from 3.6 percent;
d. Recreation, sport and culture, 2.7 percent from 2.2 percent; and
e. Personal care, and miscellaneous goods and services, 8.9 percent from 8.8 percent.
On the contrary, commodity group that recorded lower inflation was alcoholic beverages and tobacco at 7.3 percent in March 2024 from 9.1 percent in February 2024.
The indices that retained their previous month’s inflation rate were the following:
a. Furnishings, household equipment routine household maintenance, 3.6 percent
b. Information and communication, 1.3 percent;
c. Education services, 0.0 percent; and
d. Financial services, 0.0 percent.
1.2 Main Contributors to the Headline Inflation
The top three commodity groups that contributed to the March 2024 headline inflation were the following:
a. Food and non-alcoholic beverages with 43.1 percent share or 2.4 percentage points;
b. Restaurants and accommodation services with 37.8 percent share or 2.1 percentage points; and
c. Personal care, and miscellaneous goods and services with 6.7 percent share or 0.4 percentage point.
2. Food Inflation
Food inflation in the city increased to 7.3 percent in March 2024 from 4.8 percent in February 2024. In March 2023, food inflation was lower which recorded at 6.9 percent. (Table 7)
2.1 Main Drivers to the Upward Trend of Food Inflation
The acceleration of food inflation in March 2024 was mainly brought by the slower annual decrease in vegetables, tubers, plantains, cooking bananas and pulses index at 2.8 percent in March 2024 from 20.7 percent annual decline in the previous month. This was followed by fish and other seafood index at 0.5 slower year-on-year decrease from 4.9 percent annual decline in the previous month.
Cereals and cereals products which includes rice, corn, flour, bread and other bakery products, pasta products and other cereals recorded a faster annual increment of 13.5 percent in March 2024 from 12.7 percent in February 2024.
In addition, ready-made food and other food products not elsewhere classified also increased to 7.0 percent in March 2024 from 6.2 percent in the previous month.
In contrast, lower food inflation rates were also noted in the indices of the following food groups during the month:
a. Meat and other parts of slaughtered land animals, 6.2 percent from 6.8 percent;
b. Milk, other dairy products and eggs, 8.9 percent from 11.0 percent;
c. Fruits and nuts, 17.4 percent from 19.2 percent; and
d. Sugar, confectionery and desserts, 5.3 percent from 5.6 percent.
Moreover, the index of oils and fats recorded an annual decline of 0.2 percent in March 2024 from 0.1 percent annual increase in the previous month. (Table 5)
2.2 Main Contributors to the Food Inflation
Food inflation shared 42.2 percent or 2.4 percentage points to the overall inflation in March 2024. Food groups with highest contribution to food inflation during the month were the following:
a. Cereals and cereal products which includes rice, corn, flour, bread and other bakery products, pasta products, and other cereals, with 60.2 percent share or 4.4 percentage points;
b. Meat and other parts of slaughtered land animals, 15.9 percent share or 1.2 percentage points; and
c. Milk, other dairy products and eggs, with 11.1 percent share or 0.8 percentage point.
3. Overall Inflation for the Bottom 30% Income Households
The Philippines
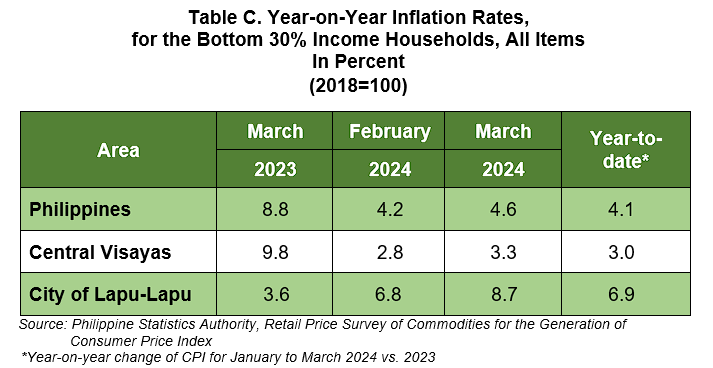
The country’s’ inflation rate for the bottom 30% income households increased to 4.6 percent in March 2024 from 4.2 percent in February 2024. In March 2023, inflation rate was posted at 8.8 percent. (Table C)
Central Visayas
Following the trend at the national level, inflation rate for the bottom 30% income households in Central Visayas also increased to 3.3 percent in March 2024 from 2.8 percent in February 2024. In March 2023, the inflation rate in the region was higher which recorded at 9.8 percent. (Table C)
City of Lapu-Lapu
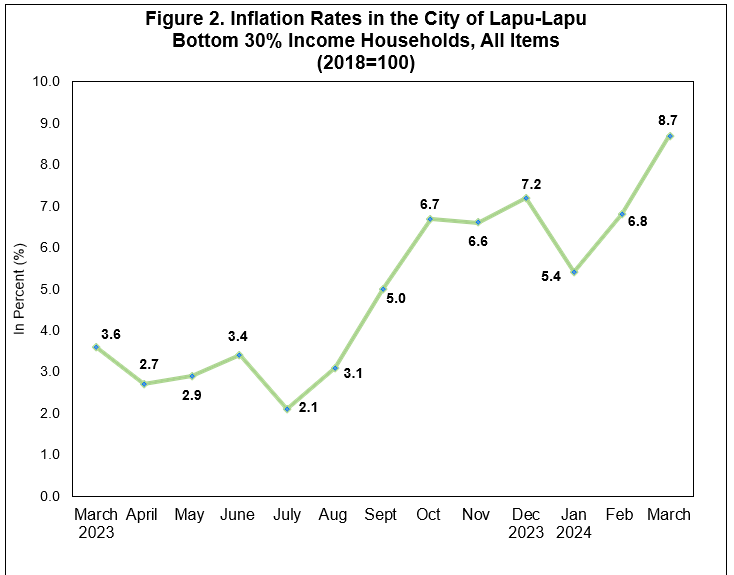
The inflation rate in the City of Lapu-Lapu for the bottom 30% income households increased to 8.7 percent in March 2024 from 6.8 percent in February 2024. In March 2023, the inflation rate was lower which recorded at 3.6 percent. (Table C and Figure 2)
3.1 Main Drivers to the Upward Trend of Overall Inflation
The main driver to the upward trend of the overall inflation rate for this income group in March 2024 was the higher annual growth of the heavily-weighted food and non-alcoholic beverages at 7.8 percent from 5.4 percent in the previous month. This was followed by housing, water, electricity, gas and other fuels index at 4.5 percent during the month from 1.7 percent in February 2024. Restaurants and accommodation services index also recorded a higher annual increment at 18.9 percent in March 2024 from 18.2 percent in February 2024.
In addition, higher inflation rates were also noted in the indices of the following commodity groups:
a. Transport, 5.9 percent from 5.3 percent;
b. Recreation, sport and culture, 12.3 percent from 9.3 percent;
c. Personal care, and miscellaneous goods and services, 17.2 percent from 17.0 percent; and
d. Health, 5.4 percent from 4.8 percent.
On the other hand, alcoholic beverages and tobacco recorded a slower annual increase at 8.0 percent in March 2024 from 10.7 percent in February 2024.
The indices of commodity groups that retained their previous month’s annual rates were as follows:
a. Clothing and footwear, 14.1 percent;
b. Furnishing, household equipment and routine household maintenance, 6.7 percent;
c. Information and communication, 2.1 percent; and
d. Financial services, 0.0 percent.
Furthermore, education services index retained its previous month’s inflation rate at 0.1 percent annual decline. (Table 3, Bottom 30%)
3.2 Main Contributors to the Overall Inflation
The following commodity groups were the top three contributors to the March 2024 overall inflation for the bottom 30% income households:
a. Food and non-alcoholic beverages with 45.3 percent share or 3.9 percentage
points;
b. Restaurants and accommodation services with 22.8 percent share or 2.0 percentage points; and
c. Personal care, and miscellaneous goods and services with 10.1 percent share or 0.9 percentage point.
TECHNICAL NOTES
The Philippine Statistics Authority generates and announces the monthly Consumer Price Index (CPI) based on a nationwide survey of prices for a given basket of goods and services. Two important indicators, the inflation rate and purchasing power of the peso (PPP), are derived from the CPI which are important in monitoring price stability and the value of the country’s currency.
The CPI is an indicator of the change in the average retail prices of a fixed basket of goods and services commonly purchased by households relative to a base year.
Retail Price is the price at which a commodity is sold for spot in small quantities for consumption.
Base Period/Base Year is the period, usually a year, at which the index number is set to 100. It is the reference point of the index number series.
Market Basket is a term used to refer to a sample of goods and services that are commonly purchased and bought by an average Filipino household.
Weight is a value attached to a commodity or ground of commodities to indicate the relative importance of that commodity or group of commodities in the market basket.
Inflation Rate is equivalent to a decline in the purchasing power of the peso. It is the change in the CPI over a specific period of time (usually a month or a year). That is,
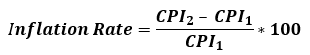
where:
CPI1 - is the CPI in the previous period
CPI2 - is the CPI in the current period
The Purchasing Power of the Peso (PPP) is a measure of the real value of the peso in a given period relative to a chosen reference period. It is computed by getting the reciprocal of the CPI and multiplying the result by 100. That is,
Headline Inflation is the rate of change in the weighted average prices of all goods and services in the CPI basket.
Approved by:
(SGD.)
MELCHOR B. BAUTISTA
Chief Statistical Specialist