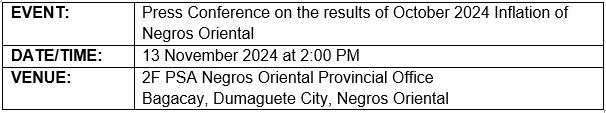
Summary Inflation Report in City of Lapu-Lapu Consumer Price Index for the Bottom 30% Income Households (2018=100) May 2024

Release Date:
Reference Number: 2024-SR22-041

A.    The Philippines

The country’s inflation rate for the bottom 30% income households retained its previous month’s rate at 5.3 percent in May 2024.This brings the average inflation for this income group from January to May 2024 to 4.6 percent. In May 2023, the inflation rate was posted at 6.7 percent. (Table A)

B. Central Visayas

1.    Regional Inflation

Inflation rate for the bottom 30% income households in Central Visayas increased to 5.7 percent in May 2024 from 3.9 percent in April 2024. The region’s average inflation for this income group from January to May 2024 stood at 3.7. In May 2023, the inflation rate in the region was higher which recorded at 7.1 percent. (Table A)

C. City of Lapu-Lapu

1. Headline Inflation

The headline inflation rate for the bottom 30% income households in the City of Lapu-Lapu had a slower increase at 8.3 percent in May 2024 from 9.3 percent in April 2024. This brings the city’s average inflation at 7.7 percent from January to May 2024.  In May 2023, the inflation rate was lower at 2.9 percent. (Table A and Figure 1)

1.1    Main Drivers to the Downward Trend of Headline Inflation in the City of Lapu-Lapu

The main drivers to the downtrend of the headline inflation rate for this income group in April 2024 were the slower year-on-year increases of food and non-alcoholic beverages at 5.7 percent, housing, water, electricity, gas and other fuels at 8.6 percent, and alcoholic beverages and tobacco at 5.7 percent from their respective previous month’s inflation rates at 7.4 percent, 9.0 percent and 8.6 percent. (Table 3)

In addition, slower annual increase in the indices of the furnishing, household equipment and routine household maintenance at 5.2 percent and personal care, and miscellaneous goods and services at 16.8 percent during the month from their respective inflation rate at 5.5 percent and 16.9 percent in April 2024. (Table 3)

On the contrary, faster annual increases were recorded in May 2024 for the indices of health at 4.9 percent from 4.7 percent and transport at 6.2 percent from 6.0 percent in April 2024. (Table 3)

Moreover, the indices of commodity groups that retained their previous month’s inflation were as follows:

a.    Clothing and footwear, 14.1 percent;
b.    Information and communication, 2.1 percent;
c.    Recreation, sport and culture, 12.3 percent;
d.    Education services, -0.1 percent;
e.    Restaurants and accommodation services, 18.9 percent; and
f.    Financial services, 0.0 percent. (Table 3)

1.2    Main Contributors to the Headline Inflation

The following commodity groups were the top three contributors to the May 2024 overall inflation for the bottom 30% income households in the City of Lapu-Lapu:

a)    Food and non-alcoholic beverages with 34.7 percent share or 2.9 percentage points;
b)    Restaurants and accommodation services with 23.9 percent share or 2.0 percentage points; and
c)    Housing, water, electricity, gas and other fuels with 18.7 percent share or 1.6 percentage point.

2. Food Inflation

Food inflation rate for the bottom 30% income households in the City of Lapu-Lapu had a slower increase at 6.2 percent in May 2024 from 7.9 percent in the previous month. In May 2023, the food inflation stood at 7.0 percent. (Table 7)

2.1    Main Drivers to the Downtrend of Food Inflation

The downtrend in the food inflation was primarily driven by the faster annual decrease in the indices of corn at 26.7 percent and fish and other seafood at 7.9 percent during the month from their respective inflation rate at 3.7 percent and 4.2 percent annual decline in April 2024. Also contributed in the deceleration of food inflation was the slower annual increase of milk, other dairy products and eggs at 8.0 percent in May 2024 from 9.8 percent in the previous month.

Moreover, slower year-on-year increase was noted in the index of fruits and nuts at 16.3 percent in May 2024 from 19.7 percent in April 2024.

In contrast, higher annual upticks were recorded in the indices of the following food groups during the month:

a.    Meat and other parts of slaughtered land animals, 9.3 percent from 5.8 percent;
b.    Vegetables, tubers, plantains, cooking bananas and pulses, 16.0 percent from 14.8 percent;
c.    Sugar, confectionery and desserts, 1.0 percent from -0.4 percent; and
d.    Ready-made food and other food products, 10.8 percent from 10.3 percent.

Meanwhile, the index of oils and fats retained its previous month’s rate at 0.1 percent.

2.2 Main Contributors to the Food Inflation

Food inflation contributed 34.2 percent share or 2.8 percentage points to the May 2024 overall inflation for this particular income group.

Among the food groups, the main contributors to the food inflation during the month were the following:

a.    Cereals and cereal products, which includes rice, corn, flour, bread and other bakery products, pasta products, and other cereals with 61.3 percent share or 3.8 percentage points;
b.    Meat and other parts of slaughtered land animals with 20.3 percent share or 1.3 percentage point; and
c.    Vegetables, tubers, plantains, cooking bananas and pulses with 14.8 percent share or 0.9 percentage point.


TECHNICAL NOTES

The Philippine Statistics Authority generates and announces the monthly Consumer Price Index (CPI) based on a nationwide survey of prices for a given basket of goods and services. Two important indicators, the inflation rate and purchasing power of the peso (PPP), are derived from the CPI which are important in monitoring price stability and the value of the country’s currency.  

The CPI is an indicator of the change in the average retail prices of a fixed basket of goods and services commonly purchased by households relative to a base year.

Retail Price is the price at which a commodity is sold for spot in small quantities for consumption.

Base Period/Base Year is the period, usually a year, at which the index number is set to 100. It is the reference point of the index number series.

Market Basket is a term used to refer to a sample of goods and services that are commonly purchased and bought by an average Filipino household.

Weight is a value attached to a commodity or ground of commodities to indicate the relative importance of that commodity or group of commodities in the market basket.

Inflation Rate is equivalent to a decline in the purchasing power of the peso. It is the change in the CPI over a specific period of time (usually a month or a year). That is, 

where: 
CPI1 - is the CPI in the previous period 
CPI2 - is the CPI in the current period

The Purchasing Power of the Peso (PPP) is a measure of the real value of the peso in a given period relative to a chosen reference period. It is computed by getting the reciprocal of the CPI and multiplying the result by 100. That is, 

Headline Inflation is the rate of change in the weighted average prices of all goods and services in the CPI basket. 


Approved by:


(SGD)MELCHOR B. BAUTISTA
Chief Statistical Specialist


MJDG/LGS