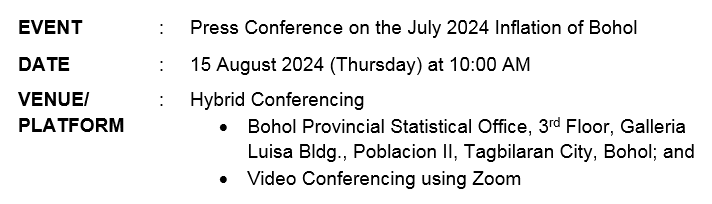
Summary Inflation Report in Central Visayas, Consumer Price Index (2018=100): August 2023

Release Date:
Reference Number: 2023-SR07-025

Starting February 2022, the Philippine Statistics Authority (PSA) released the rebased Consumer Price Index (CPI) for all income households to base year 2018, from base year 2012 as announced in the press release number 2022-01 dated 04 January 2022. The CPI series for all income households for January 2022 onwards will be 2018-based.

A. The Philippines

The Philippines’ headline inflation or overall inflation increased to 5.3 percent in August 2023 from 4.7 percent in July 2023. This brings the national average inflation from January to August 2023 to 6.6 percent. In August 2022, inflation rate was higher at 6.3 percent. (Table A)


By Region

Relative to their respective July 2023 inflation rates, 13 regions had higher inflation rates in August 2023. On the contrary, two regions namely Region V (Bicol Region) and Region XI (Davao Region) recorded lower inflation rates during the month, while the remaining two regions, Region VII (Central Visayas) and BARMM maintained its  rate as in the previous month. Region III (Central Luzon) had the highest inflation rate during the month at 7.0 percent, while Region VIII (Eastern Visayas) had the lowest inflation rate at 3.1 percent. (Figure 1)


B. Central Visayas

1. Regional Inflation

The inflation rate in Central Visayas remained at 4.1 percent in August 2023 as it recorded the same annual growth rate as in July 2023. Inflation in August 2022 was higher at 7.4 percent. (Table A, B and Figure 2)


1.1 Main Drivers to the Trend of the Regional Inflation

Faster annual increases were observed in the indices of the following commodity groups during the month: (Table 3)

  1. Furnishings, household equipment and routine household maintenance, 4.8 percent from 4.3 percent;

  2. Health, 4.0 percent from 3.7 percent;

  3. Recreation, sport and culture, 2.3 percent from 1.8 percent;

  4. Education services, 6.3 percent from 5.9 percent; and

  5. Personal care, and miscellaneous goods and services, 5.1 percent from 4.9 percent.

Transport index had slower annual decrease of -1.4 percent in August 2023 from -6.9 percent in the previous month.  

On the other hand, slowdowns were observed in the indices of the following commodity groups: (Table 3)

a.    Food and non-alcoholic beverages, 4.6 percent from 5.4 percent;

b.    Alcoholic beverages and tobacco, 10.4 percent from 11.3 percent;

c.    Housing, water, electricity, gas and other fuels, 4.9 percent from 6.8 percent; and

d.    Restaurants and accommodation services, 4.0 percent from 4.3 percent.

Meanwhile, the indices of the following commodity groups retained their corresponding previous month’s annual increments: (Table 3)

a.  Clothing and footwear, 3.1 percent;

b.  Information and communication, 0.9 percent; and

c.   Financial services, 0.0 percent.

1.2 Main Contributors to the Regional Inflation

The top three commodity groups contributing to the 4.1 percent regional inflation in August 2023 were the following:

a.    Food and non-alcoholic beverages with 43.3 percent share or 1.8 percentage points;

b.    Housing, water, electricity, gas and other fuels at 28.5 percent share or 1.2 percentage points; and

c.    Restaurants and accommodation services at 8.8 percent share or 0.4 percentage point. 

2. Food Inflation

Food inflation at the regional level slowed down further to 4.3 percent in August 2023 from 5.2 percent in July 2023. This is the sixth consecutive month of deceleration in food inflation and the lowest since January 2022. In August 2022, food inflation was recorded at 10.6 percent.  (Table 7)

 2.1 Main Drivers to the Downward Trend of Food Inflation

The deceleration of food inflation in August 2023 was primarily influenced by the annual decrease in the following food items: (Table 5)

a.    Corn, -17.5 percent from 0.7 percent

b.    Sugar, confectionery and desserts, 10.5 percent from 26.5 percent; and

c.    Oils and fats, 8.5 percent from 11.2.

Lower inflation rates during the month were also noted in the indices of the following food items: (Table 5)

  1. Flour, bread and other bakery products, pasta products, and other cereal, 10.9 percent from 11.5 percent;
  2. Milk, other dairy products, and eggs, 6.6 percent from 6.9 percent;
  3. Vegetables, tubers, plantains, cooking bananas and pulses, 18.4 percent from 18.7 percent; and
  4. Ready-made food and other food products not elsewhere classified, 6.8 percent from 7.3 percent.

Meanwhile, compared with their previous month’s inflation rates, higher year-on-year growth rates were observed in the indices of the following food groups during the month: (Table 5)

  1. Rice, 7.4 percent from 4.1 percent;         
  2. Meat and other parts of slaughtered land animals, 0.2 percent from -0.7 percent; and
  3. Fish and other seafood, 4.4 percent from 2.2 percent.

Further, fruits and nuts retained its previous month’s inflation rate at 7.1 percent.

2.2 Main Contributors to the Food Inflation

Food shared 38.2 percent or 1.6 percentage points to the overall inflation in August 2023. Food groups with the highest contribution to food inflation during the month were the following:  

  1. Vegetables, tubers, plantains, cooking bananas and pulses with 28.9 percent share or 1.2 percentage points;
  2. Cereals and cereal products which includes rice, corn, flour, bread and other bakery products with 18.0 percent share or 0.8 percentage point; and
  3. Fish and other seafood, with 17.7 percent share or 0.8 percentage point.  

C. By Province

Similar to the trend at the national level, all provinces and Highly Urbanized Cities (HUCs) of Central Visayas except the Province of Cebu recorded higher inflation rates during the month relative to their July 2023 annual rates.

Among the provinces, Negros Oriental had the highest inflation rate at 6.8 percent while the Province of Cebu recorded the lowest inflation rate in August 2023 at 2.5 percent.

Further, among HUCs, the City of Cebu recorded the highest inflation rate in     August 2023 at 4.0 percent, while City of Lapu-Lapu posted the lowest inflation rate at 2.9 percent. (Table A, Figure 3)


TECHNICAL NOTES

The Philippine Statistics Authority generates and announces the monthly Consumer Price Index (CPI) based on a nationwide survey of prices for a given basket of goods and services. Two important indicators, the inflation rate and purchasing power of the peso (PPP), are derived from the CPI which are important in monitoring price stability and the value of the country’s currency. 

The CPI is an indicator of the change in the average retail prices of a fixed basket of goods and services commonly purchased by households relative to a base year.

Retail Price is the price at which a commodity is sold for spot in small quantities for consumption.

Base Period/Base Year is the period, usually a year, at which the index number is set to 100. It is the reference point of the index number series.

Market Basket is a term used to refer to a sample of goods and services that are commonly purchased and bought by an average Filipino household.

Weight is a value attached to a commodity or ground of commodities to indicate the relative importance of that commodity or group of commodities in the market basket.

Inflation Rate is equivalent to a decline in the purchasing power of the peso. It is the change in the CPI over a specific period of time (usually a month or a year). That is, where:

CPI1 - is the CPI in the previous period

CPI2 - is the CPI in the current period

The Purchasing Power of the Peso (PPP) is a measure of the real value of the peso in a given period relative to a chosen reference period. It is computed by getting the reciprocal of the CPI and multiplying the result by 100. That is,

Headline Inflation is the rate of change in the weighted average prices of all goods and services in the CPI basket. 


Approved by:

(SGD.) ARIEL E. FLORENDO
Regional Director

Attachment Size
PDF 2023-SR07-025.pdf 1.93 MB