

Release Date :
Reference Number :
2022-SR61-003
MEN AND WOMEN IN SIQUIJOR
POPULATION AND DENSITY
Total Population
Based on the 2020 Census of Population and Housing, the total population of Siquijor Province as of 01 May 2020 is 103,395. This is 7,411 persons more than its total population of 95,984 persons in 2015. The increase of the total population of the province from 2015 to 2020 translated into an average annual population growth rate (PGR) of 1.58 percent. With this result, the province ranks third having the least population in the entire Philippines.
Among the six (6) municipalities, the provincial capital, Siquijor was the most populous municipality with 28,915 persons while the least populated municipality was Enrique Villanueva with 6,790 persons which was also the least populated municipality in Central Visayas in 2020.
From the result on the 2020 Census of Population and Housing, the Province of Siquijor posted a population density of 306 persons per square kilometer. This represents an increase of 7.7% or 22 persons per square kilometers from the 284 persons per square kilometers in 2015.
Of the six (6) municipalities, Enrique Villanueva had the lowest population density at 237 persons per square kilometer while the Municipality of San Juan had the highest population density at 369 persons per square kilometer.
Birth Statistics, 2018
In 2018, 51.8 percent of live births by place of occurrence were males. This was 42 persons higher compared to the number of female live births. The Municipality of Siquijor (capital) recorded the highest live births of both sexes at 1,041 by place of occurrence while the Municipality of San Juan registered the lowest number of live births of both male and female at 0 and 4, respectively. (See Table 3)
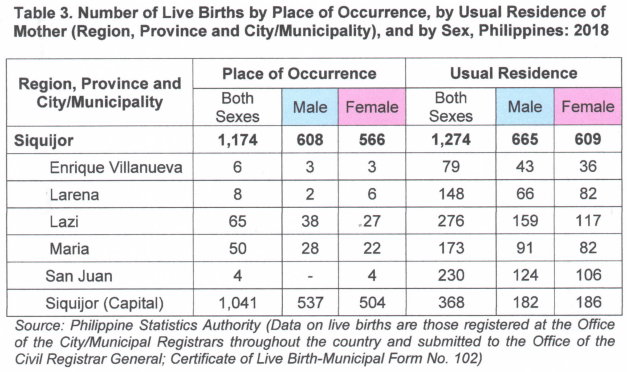
In the same year, male live birth by usual residence of mother posted at 52.2 percent which is higher than four percent by female live birth by usual residence of mother. The Municipality of Siquijor still recorded the highest number of live births of both sexes at 1,274 while the Municipality of Enrique Villanueva registered the lowest number of live births of both male and female at 43 and 36, respectively.
Birth Statistics, 2019
The percentage of live births of female by place of occurrence in the year 2019 was at 2.2 percent lower compared to males. It was comprised of 633 males or 51.1 percent and 606 females or 48.9 percent of the total live births by place of occurrence. The Municipality of Siquijor (capital) had the highest number of live births by place of occurrence at 1, 152 or 93.0 percent from the total with 589 males and 563 females. On other hand, the Municipality of San Juan recorded the lowest number of live births by place of occurrence in the year 2019 at 4 or 0.3 percent from the total with 3 males and 1 female. (See Table 4)
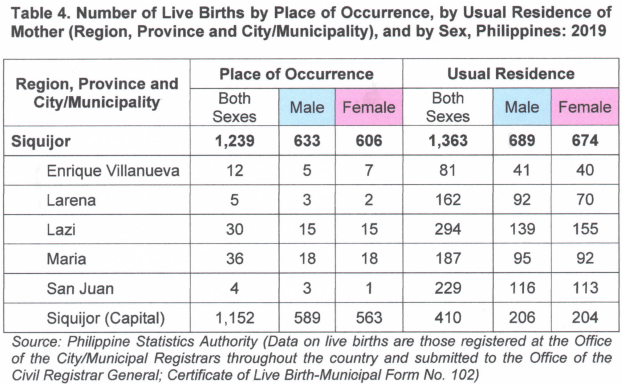
By usual residence of mother of year 2019, male live births still posted at 689 or 50.6 percent of the total while female registered at 674 or 49.4 percent of the total. The Municipality of Lazi had the highest number of live births by usual residence of mother at 294 or 21.6 percent of the total with 139 males and 155 females while the Municipality of Enrique Villanueva had the lowest number of live births by usual residence of mother at 81 or 5.9 percent of the total with 41 males and 40 females.
Birth Statistics, 2020
Percentage of live births of males by place of occurrence in the year 2020 was at 52.7 percent or at 647 in count. This was higher by 66 or 5.4 percent compared to female with 581 record of live birth or at 47.3 percent. Siquijor (capital) municipality still recorded the highest number of live births by place of occurrence at 1,155 or 94.1 percent of the total with 604 males and 551 females. This was followed by Lazi municipality at 39 or 3.2 percent of the total with 22 males and 17 females. There was no record of the number of live births by place of occurrence in the same year. (See Table 5)
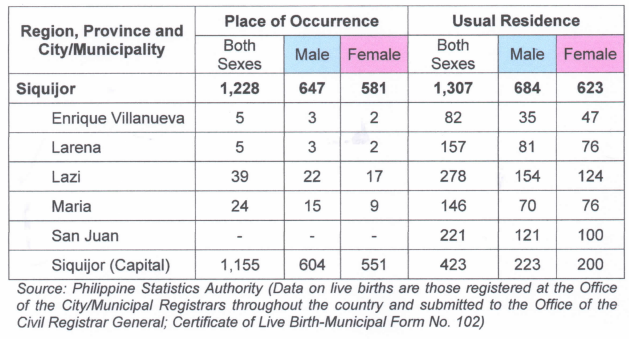
In 2020, the number of male live births by usual residence of mother in the province was still higher compared to female. Records for male posted at 684 or 52.3 percent while female recorded at 623 or 47.7 percent of the total for both sexes. Having the total of 423 for both sexes for the number of live births by usual residence of mother, Siquijor (capital) ranked at the top. It was followed by Lazi at 278 or 21.2 percent with 154 males and 124 females. Despite of having no record for the number of live births by place of occurrence, San Juan ranked third in terms of the number of live births by usual residence of mother at 221 or 17 percent with 121 males and 100 males. On the other hand, Enrique Villanueva had the lowest number of live births by usual residence of mother at 82 or 6.3 percent with 35 males and 47 females.
Death Statistics, 2018
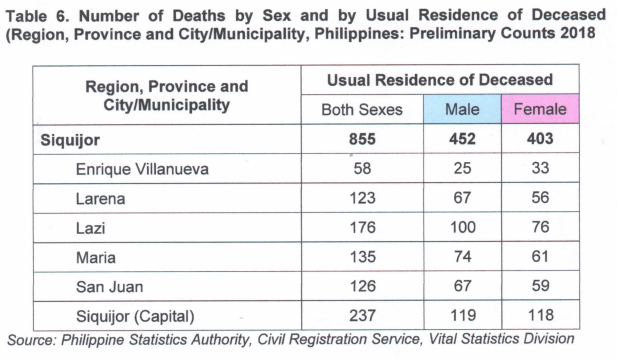
In 2018, the Province of Siquijor recorded 855 deaths with 452 males and 403 females. The Municipality of Siquijor had the highest number of deaths at 237 with 119 males and 118 females. This is 27.7 percent share to the total number of deaths by usual residence of deceased in the province. On the other hand, the Municipality of Enrique Villanueva had the lowest number of deaths by usual residence of deceased at 58 with 43.1 percent or 25 males and 56.9 percent or 33 females. This is 6.8 percent to the total deaths in the province. (see Table 6)
Death Statistics, 2019
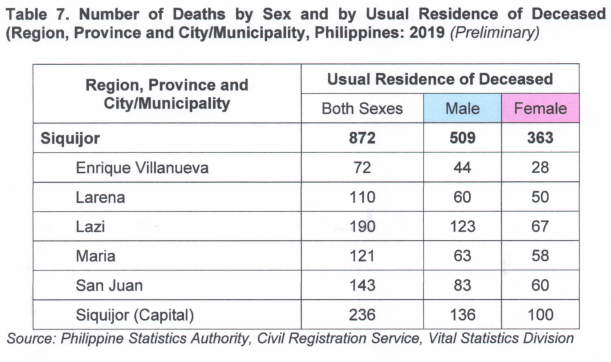
The percentage of male deaths by usual residence of deceased in the Province of Siquijor in the year 2019 was 58.4 percent. This was higher by 16.8 percent to female deaths in the same year. The Municipality of Siquijor recorded the highest number of deaths at 236 or 27.1 percent of the total deaths in the province with 136 males and 100 females while the Municipality of Enrique Villanueva registered the lowest number of deaths at 72 or 8.6 percent of the total with 44 males and 28 females. (see Table 7)
Death Statistics, 2020
Female deaths in the Province of Siquijor in 2020 was lower compared to male deaths by usual residence of deceased. This was 65 persons lower or 46.0 percent of total in the province. Siquijor had the highest registered deaths at 232 with 126 males and 106 females while Enrique Villanueva still had the lowest registered deaths at 54 with 30 males and 24 females. (see Table 8)

Index and Non-Index Crimes, 2018 - 2020
The Province of Siquijor recorded a total of 224 crimes both index and non-index crimes in 2018 with counts of 56 and 168, respectively. The Municipality of Siquijor had the highest recorded of crimes at 20 or 35.7 percent of the total with 20 recorded index crimes and 33 non-index crimes while the Municipality of Enrique Villanueva had the lowest at 15. For having the lowest record in the entire province, no posted record for index crimes while non-index crimes had a posted record of 15. (see Table 9)
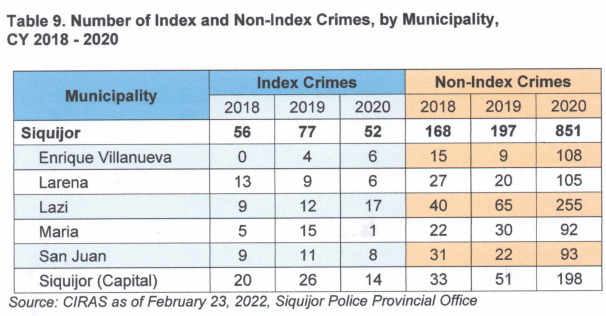
In 2019, the Province of Siquijor had a total record of 274 crimes which was 50 counts higher than in 2018 with highest percentage in non-index crimes at 197 or 71.9 percent of the total. The Municipalities of Lazi and Siquijor had the highest registered crimes at 77 with 26 index crimes and 51 non-index crimes. Enrique Villanueva still had the lowest registered crimes at 13 with 4 index crimes and 9 non-index crimes.
Year 2020 showed a large increase of crimes in the province for non-index crimes at 851. This was 654 counts higher than in 2019 at 197. On the other hand, index crimes in the same year posted a record of 52 which is 25 counts lower in 2019. The Municipality of Lazi in this year had the highest number of registered crimes at 272 with 17 index crimes and 255 non-index crimes. In the same year, the Municipality of Maria had the lowest number of crimes at 93 with 1 recorded index crime and 92 recorded non-index crimes.
| Attachment | Size |
|---|---|
|
|
6.94 MB |