Provincial Product Accounts (PPA)
2021-2023 Economic Performance of City of Cebu
Release Date:Reference Number: 2024-SR22-092The economy of the City of Cebu grew by 8.3 percent in 2023.
The economy of the City of Cebu posted 8.3 percent growth in 2023, slower than the 8.5 percent growth registered in the previous year. The Gross Domestic Product (GDP) of the city expanded to PhP 312.71 billion in 2023 from the PhP 288.77 billion recorded in 2022 (Figure 1).
Figure 1. Gross Domestic Product of the City of Cebu
In Term of Level (in Billion PhP) and Growth Rate (in Percent)
At Constant 2018 Prices, 2021 to 2023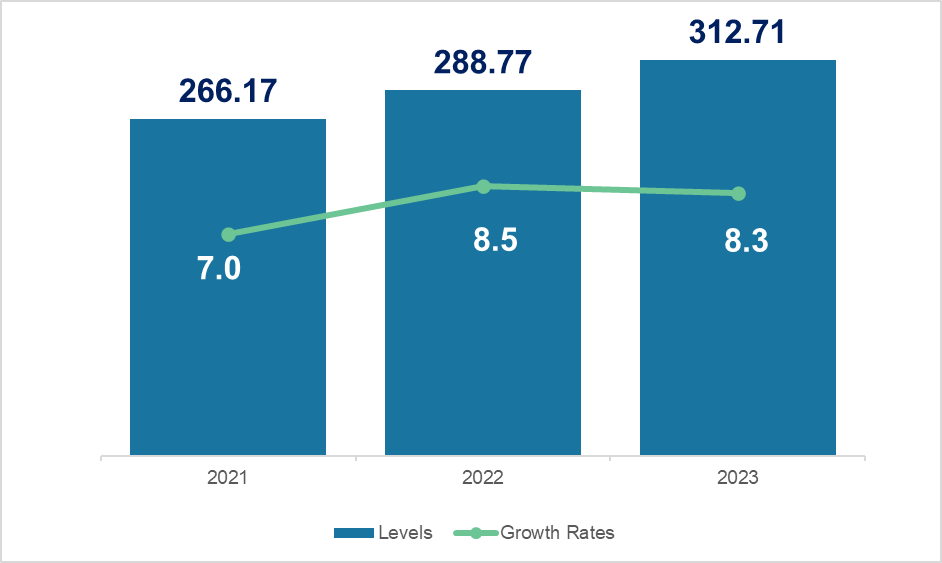
Source: Philippine Statistics Authority
Economic Performance of City of Cebu by Industry
With regards to the performance of major industries in the City of Cebu, all three major industries posted growth in 2023. Agriculture, forestry, and fishing with 1.0 percent growth, Industry with 5.7 percent growth, and Services with 8.6 percent growth. (Figure 2).
Figure 2. Economic Structure of City of Cebu
In Terms of Level (in Billion PhP), 2021 to 2023 and Growth Rate, 2023
At Constant 2018 Prices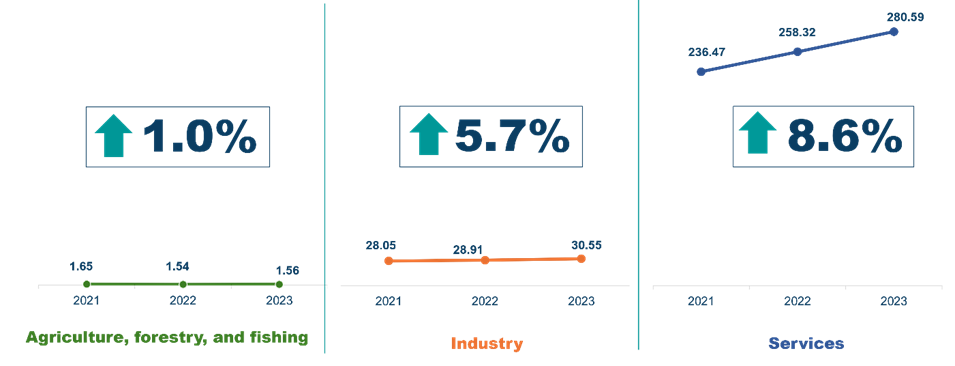
For the contribution of each major industry to the 8.3 percent economic growth; Services shared 7.7 percentage points, Industry shared 0.6 percentage points and Agriculture, forestry, and fishing contributed 0.006 percentage points (Table 1).
In terms of performance of the 16 production industries, all contributed positively to the growth of the economy. The major contributors to the 8.3 percent growth of the province were: Financial and insurance activities which contributed 1.9 percentage points; Wholesale and retail trade; repair of motor vehicles and motorcycles with 1.8 percentage points contribution; and Accommodation and food service activities with
1.2 percentage points. Meanwhile, the top 3 fastest growing industries were: Accommodation and food service activities with 35.4 percent growth, Other Services with 28.3 percent growth, and Construction 12.4 percent growth (Table 1).Table 1. Economic Performance of City of Cebu by Industry
At Constant 2018 Prices, 2022 to 2023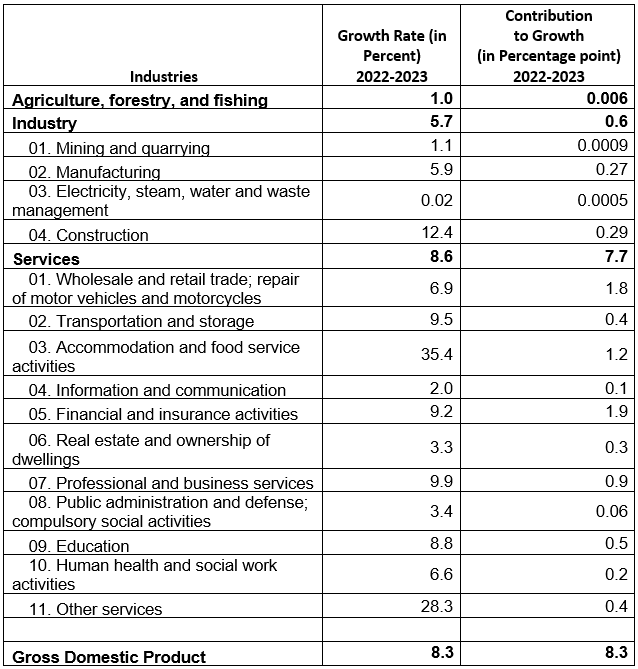
Note: Details may not add up due to rounding
Source: Philippine Statistics AuthorityCity of Cebu is mainly driven by Services among major industries
The share of the three major industries to the economy of the City of Cebu, Services had the largest share of 89.7 percent, followed by Industry with 9.8 percent share and Agriculture, forestry, and fishing with 0.5 percent share. (Figure 3).Figure 3. Economic Structure of City of Cebu
In terms of Share of Major Industries to GDP (in Percent), 2023
At Constant 2018 Prices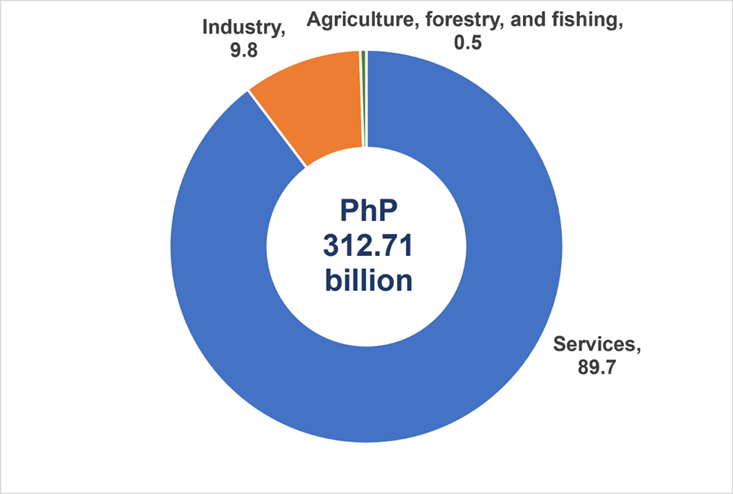
Note: Details may not add up due to rounding
Source: Philippine Statistics AuthorityAmong the 16 industries, Wholesale and retail trade; repair of motor vehicles and motorcycles had the largest share of about 26.1percent of the total economy of the city. This was followed by Financial and insurance activities, with 20.5 percent share, and Real estate and ownership of dwellings, with 9.0 percent share. (Figure 4).
Figure 4. Economic Structure of City of Cebu
In Terms of Share of Industries to GDP (in Percent), 2023
At Constant 2018 Prices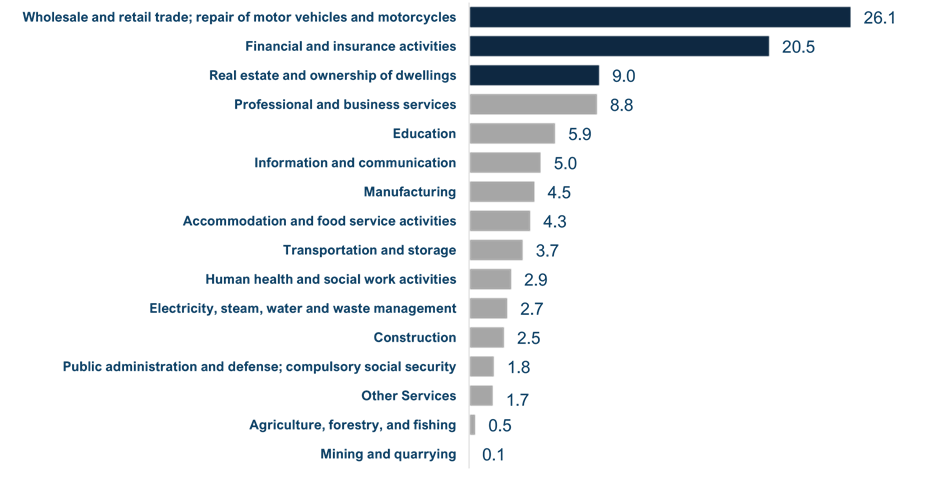
Note: Details may not add up due to rounding
Source: Philippine Statistics AuthorityPer Capita Gross Domestic Product of City of Cebu
The Per Capita GDP of City of Cebu was estimated at 316,405 pesos in 2023, 7.8 percent higher than the 293,554 pesos recorded in 2022 (Figure 5).
Figure 5. Per Capita GDP of City of Cebu
In Terms of Levels (in PhP): 2023
At Constant 2018 Prices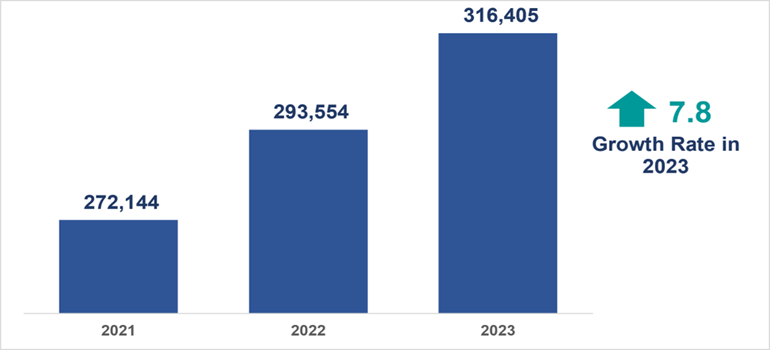
Technical Notes:
• Provincial Product Accounting (PPA) is a mechanism, following with the Philippine System of National Accounts (PSNA), that aims to present a comprehensive picture of the provincial and Highly Urbanized City (HUC) economies.
• Through the PPA, the Gross Domestic Product (GDP) or the economic performance of the provinces and HUCs are estimated.
• This will serve as an important tool in economic planning and policy formulation at the subregional levels to supplement the GDP at the national and regional levels or the Gross Regional Domestic Product (GRDP)
• By providing a more appropriate measure and assessment of a province’s economic performance, the PPA is viewed to strengthen the planning and decision-making of provincial policymakers and other stakeholders.
• The GDP at the provincial and HUC level is computed by Production Approach.
• That is, GDP of the province/HUC is measured from the perspective of the producers of goods and services. It covers the value of goods and services produced in the province/HUC during the reference period.
• In this approach, GDP measures the contribution of the 16 production industries, namely:
- Agriculture, forestry, and fishing;
- Mining and quarrying;
- Manufacturing;
- Electricity, steam, water, and waste management;
- Construction;
- Wholesale and retail trade; repair of motor vehicles and motorcycles;
- Transportation and storage;
- Accommodation and food service activities;
- Information and communication;
- Financial and insurance activities;
- Real estate activities;
- Professional, and business services;
- Public administration and defense; compulsory social security;
- Education;
- Human health and social work activities; and
- Other services.
Approved by:
MELCHOR B. BAUTISTA
Chief Statistical Specialist
LGCS/AGD/PPGT
Attachment Size  2024-SR22-092.pdf
1.69 MB


