A. Incidences and Magnitude
1. Poverty Incidence and Magnitude of Poor Families in the Province of Cebu (including Highly Urbanized Cities)
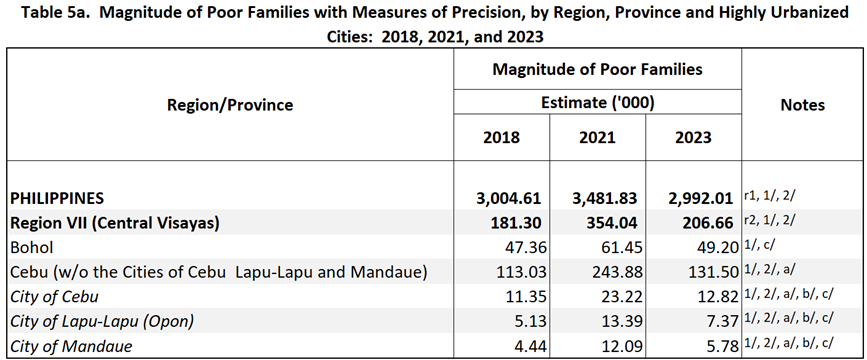
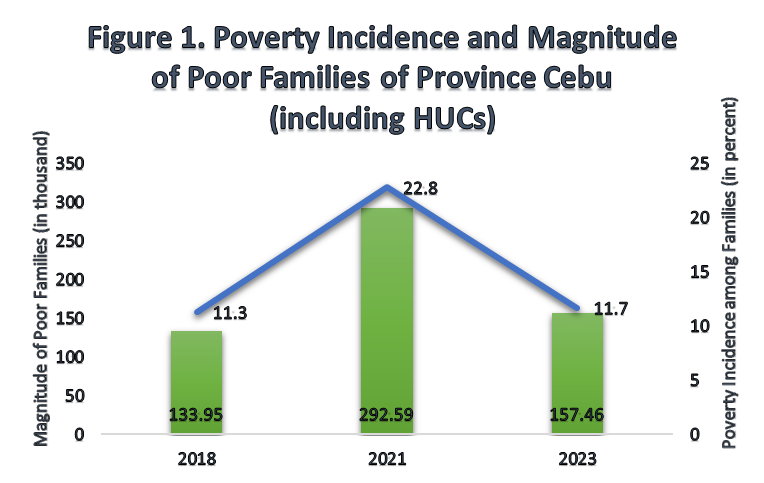
The 2023 Family Income and Expenditure Survey (FIES) which concluded in July 2023 (collected income data from January to June 2023) and January 2024 (collected income data from July to December 2023), indicate that 11.7 percent, or approximately 157,460 families in the Province of Cebu, including the three Highly Urbanized Cities, experienced poverty in 2023. This represents the proportion of families whose incomes are insufficient to meet their basic food and non-food needs, as estimated by the poverty threshold. This year’s poverty incidence among families has decreased by 11.1 percentage points from its 2021 level of 22.8 percent, or approximately 292,590 families, but increased by 0.4 percentage points from its 2018 level of 11.3 percent, or approximately 133,950 families. (Figure 1)
Source: Philippine Statistics Authority
1.1 Poverty Incidence and Magnitude of Poor Families by Domains
In 2023, it was observed that areas within the Province of Cebu, excluding the three Highly Urbanized Cities or HUCs (City of Cebu, City of Mandaue, City of Lapu-Lapu), exhibited the highest incidence of poverty among families, with a rate of 15.5 percent, equivalent to approximately 131,500 families. Subsequently, the City of Lapu-Lapu reported a poverty rate of 5.6 percent, which estimated to 7,370 families. The City of Cebu followed closely with a poverty rate of 5.3 percent, corresponding to roughly 12,820 families. In contrast, the City of Mandaue emerged as the least impoverished domain, exhibiting a poverty incidence among families estimated at 4.7 percent, or approximately 5,780 families in 2023. (Table A)
Table A. Poverty Incidence and Magnitude Among Families by Domains

Source: Philippine Statistics Authority
2. Poverty Incidence and Magnitude of Poor Population in the Province of Cebu (including Highly Urbanized Cities)
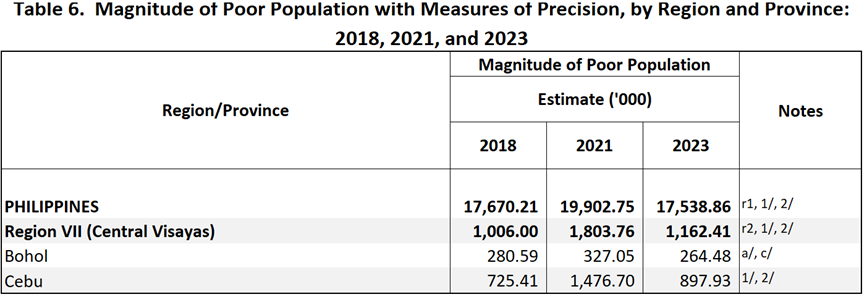
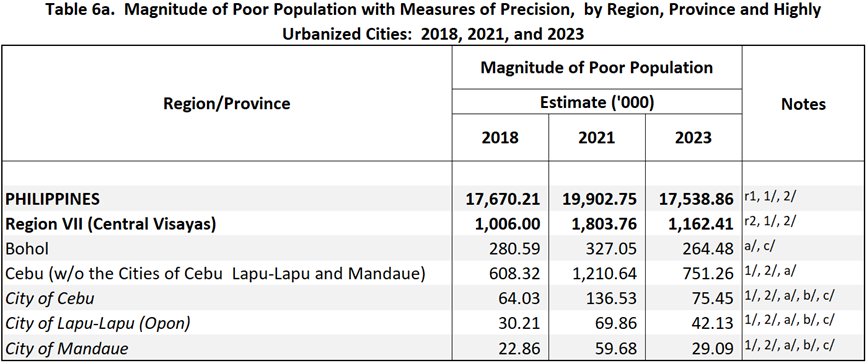
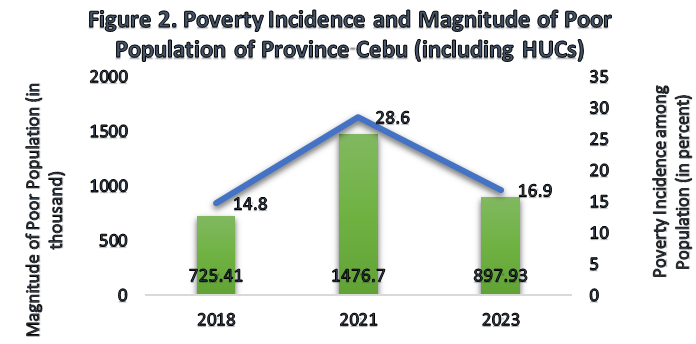
The poverty rate of the population in the Province of Cebu (including HUCs) was estimated to be 16.9 percent in 2023, indicating that approximately 897,930 individuals had incomes below the threshold required to meet their basic food and non-food needs. This represents a significant decrease of 11.7 percentage points compared to 2021, when the poverty rate stood at 28.6 percent or approximately 1,476,700 individuals. However, it is important to note that the poverty rate in 2023 still indicates an increase of 2.1 percentage points compared to 2018, when it was recorded at 14.8 percent or roughly 725,410 individuals. (Figure 2)
Source: Philippine Statistics Authority
2.1 Poverty Incidence and Magnitude of Poor Population by Domains
In 2023, the highest poverty incidence among families was observed in areas of the Province of Cebu, excluding the three Highly Urbanized Cities, affecting 21.9 percent or approximately 751,260 individuals. Conversely, the City of Mandaue recorded the lowest poverty incidence, with 7.2 percent or approximately 29,090 individuals affected. Additionally, City of Lapu-Lapu and City of Cebu had poverty incidences of 8.6 percent (approximately 42,130 individuals) and 7.6 percent (approximately 75,450 individuals), respectively. (Table B)
Table B. Poverty Incidence and Magnitude Among Population by Domains

Source: Philippine Statistics Authority
3. Magnitude of Subsistence Incidence and Magnitude of Subsistence Poor among Families and Population in Province of Cebu
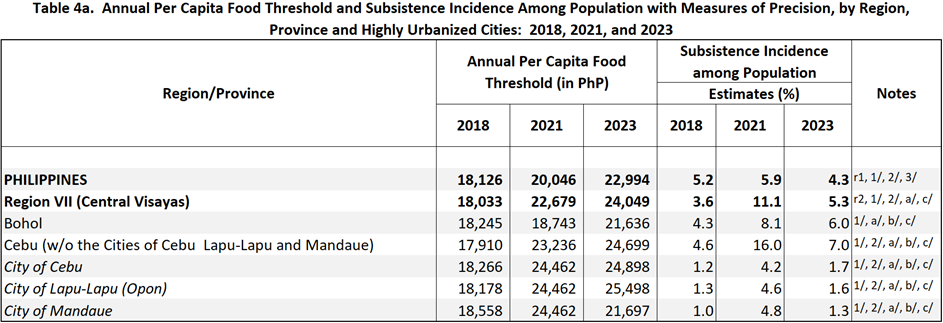
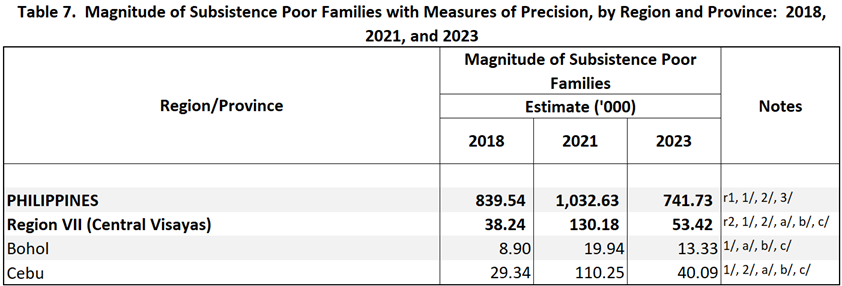
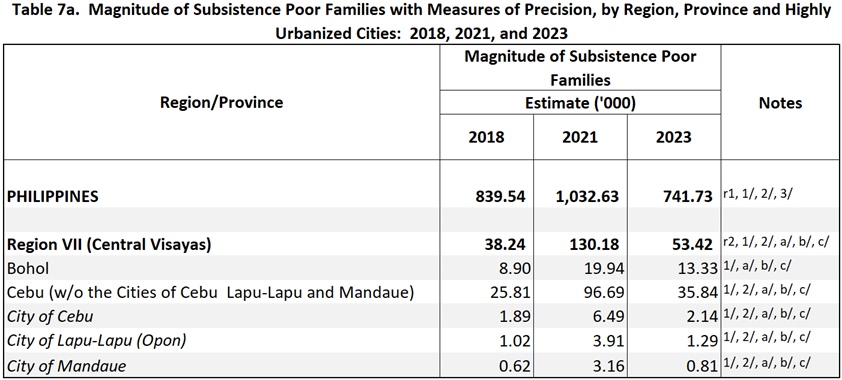
In 2023, the subsistence incidence among families, defined as the percentage of families with insufficient earnings to meet their basic food requirements in the Province of Cebu (including HUCs), was estimated to be 3.0 percent, representing approximately 40,090 families. This indicates a significant improvement compared to 2021, when the proportion of food-poor families in the Province of Cebu was recorded at 8.6 percent, equivalent to approximately 110,250 families. Furthermore, in 2018, the subsistence incidence stood at 2.5 percent, representing approximately 29,340 families. (Table C)
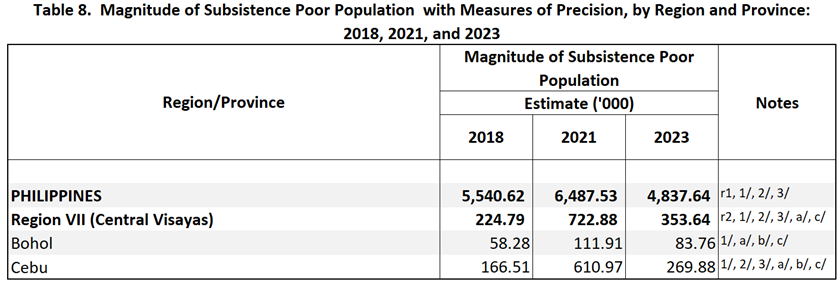
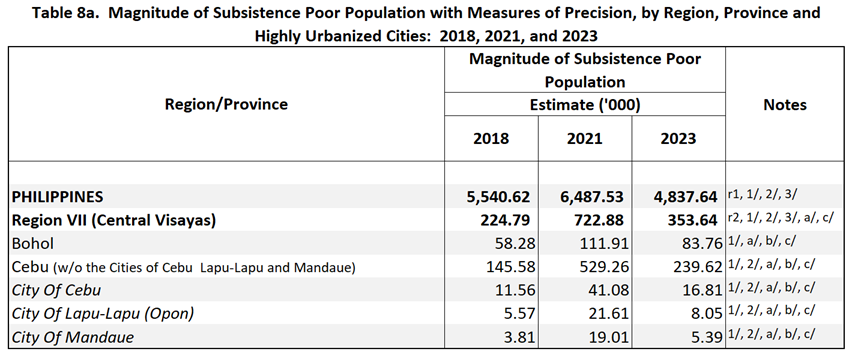
The prevalence of subsistence incidence within the provincial population was estimated to be 5.1 percent, corresponding to approximately 269,880 individuals in the year 2023. This represents a significant decrease compared to 2021, when the subsistence incidence rate stood at 11.8 percent, equivalent to roughly 610,970 individuals. In contrast, during 2018, the subsistence incidence rate in the Province of Cebu was recorded at a lower level of 3.4 percent, corresponding to approximately 166,510 individuals. (Table C)
Table C. Subsistence Incidence and Magnitude among Families and Population in Province of Cebu

Source: Philippine Statistics Authority
3.1 Magnitude of Subsistence Incidence among Families by Domains
In 2023, the highest subsistence incidence among families was observed in Cebu areas, excluding the three Highly Urbanized Cities, with a rate of 4.2 percent, which corresponds to an estimate of 35,840 families. This was followed by the City of Lapu-Lapu with a rate of 1.0 percent (roughly 1,290 families) and City of Cebu with a rate of 0.9 percent (roughly 2,140 families). In contrast, the City of Mandaue recorded the lowest subsistence incidence at 0.7 percent (roughly 810 families). (Table D)
Table D. Food Threshold and Subsistence Incidence Among Families

Source: Philippine Statistics Authority
3.2 Magnitude of Subsistence Incidence among Population by Domains
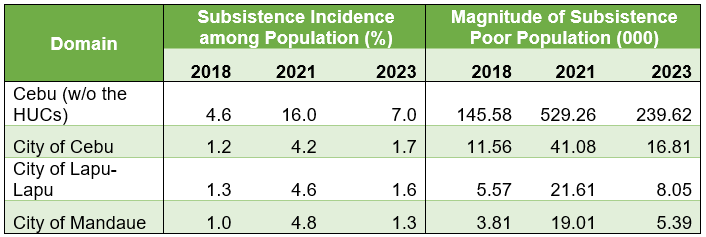
In 2023, the Province of Cebu, excluding the three HUCs, experienced the highest subsistence incidence among its population, with 7.0 percent or approximately 239,620 individuals living in poverty. In contrast, the City of Mandaue recorded the lowest subsistence incidence, with 1.3 percent or an estimate of 5,390 individuals affected. Furthermore, the City of Cebu and the City of Lapu-Lapu had the second and third highest incidence rates, with 1.7 percent (approximately 16,810 individuals), and 1.6 percent (approximately 8,050 individuals), respectively. (Table E)
Table E. Food Threshold and Subsistence Incidence Among Population
Source: Philippine Statistics Authority
B. Thresholds and Income
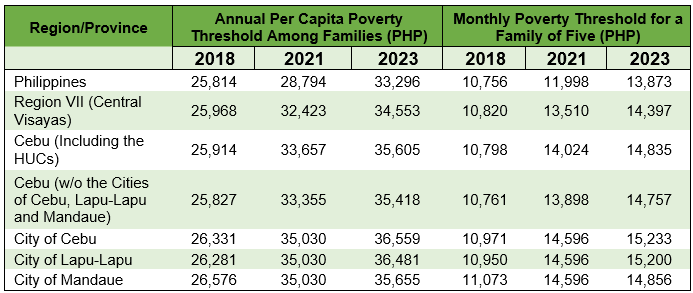
The average family of five in the Province of Cebu, including the three Highly Urbanized Cities, will require a minimum of PHP14,835 per month to meet their basic food and non-food needs in 2023. This poverty threshold represents a 5.8 percent increase from the projected PHP14,024 monthly poverty threshold for a family of five in 2021. (Table F)
Within the domains, a family of five in Cebu areas excluding the three Highly Urbanized Cities had the lowest required amount for the monthly poverty threshold, which is PHP14,757 to afford basic food and non-food necessities. This represents a 6.2 percent increase from the estimated PHP13,898 monthly poverty threshold in 2021. Furthermore, the other three domains also experienced a significant increase in the monthly poverty threshold for a family a five. The City of Mandaue, the City of Lapu-Lapu, and the City of Cebu will need to have respective monthly incomes of PHP14,856, PHP15,200 and PHP15,233 in 2023. (Table F)
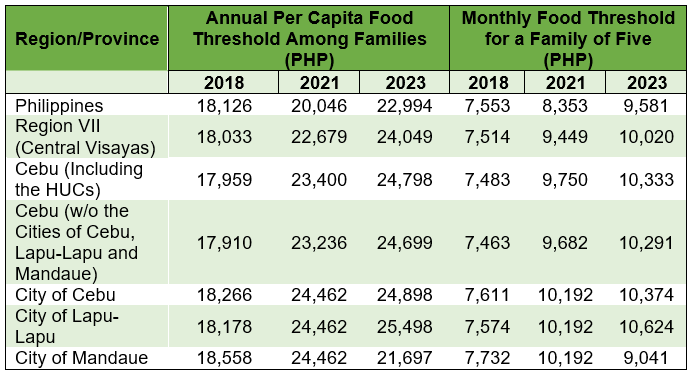
A family of five residing in the Province of Cebu, including the HUCs, will require a minimum of PHP10,333 per month to satisfy their basic food requirements in 2023. This represents a 6.0 percent increase compared to the projected PHP9,750 monthly food threshold for a family of five in 2021. Similarly, all domains except the City of Mandaue surpassed the anticipated monthly food threshold for 2021. To afford the essential food necessities during the year, a family of five in Cebu areas excluding HUCs, City of Cebu, City of Lapu-Lapu, and City of Mandaue will require respective monthly food thresholds of PHP10,291, PHP10,374, PHP10,624, and PHP9,041. Notably, the City of Mandaue’s food threshold decreased by 11.3 percent in 2023 compared to 2021. (Table G)
It is to be noted that the income recorded in the FIES is derived from various sources, including wages and salaries, entrepreneurial activities and other sources of income. These other sources of income encompass net share, foreign and domestic cash receipts, rental income, interest, pensions, dividends, net receipts, gifts (both monetary and in-kind), and imputed rent.
Table F. Annual Per Capita Poverty Threshold (PHP) and Monthly needed a Family of Five (PHP)
Source: Philippine Statistics Authority
Table G. Annual Per Capita Food Threshold (PHP) and Monthly needed for a Family of Five (PHP)
Source: Philippine Statistics Authority
Approved by:
MELCHOR B. BAUTISTA
Chief Statistical Specialist
LGCS/MJDG
Glossary of Terms
Food threshold - the minimum income required for a family/individual to meet the basic food needs, which satisfies the nutritional requirements for economically necessary and socially desirable physical activities
Income Gap - the average income shortfall (expressed in proportion to the poverty threshold) of families/individuals with income below the poverty threshold divided by the total number of poor families/individuals
Note: The difference between the income gap and the poverty gap is the use of number of poor families/ individuals as denominator for the income gap. For the poverty gap, the total number of families/individuals is used.
Poverty gap - the total income shortfall (expressed in proportion to the poverty threshold) of families/ individuals with income below the poverty threshold divided by the total number of families/ individuals
Poverty incidence - the proportion of families/individuals with per capita income less than the per capita poverty threshold to the total number of families/individuals Poverty threshold - the minimum income required for a family/individual to meet the basic food and non-food requirements
Note: Basic food requirements are currently based on 100% adequacy for the Recommended Energy and Nutrient Intake (RENI) for protein and energy equivalent to an average of 2000 kilocalories per capita, and 80% adequacy for other nutrients. On the other hand, basic non-food requirements, indirectly estimated by obtaining the ratio of food to total basic expenditures from a reference group of families, cover expenditures on: 1) clothing and footwear; 2) housing; 3) fuel, light, water; 4) maintenance and minor repairs; 5) rental of occupied dwelling units; 6) medical care; 7) education; 8) transportation and communication; 9) non-durable furnishings; 10) household operations; and 11) personal care & effects.
Severity of poverty - the total of the squared income shortfall (expressed in proportion to the poverty threshold) of families/ individuals with income below the poverty threshold divided by the total number of families/ individuals
Note: This is equal to the Foster-Greer-Thorbecke (FGT) family of measures with alpha = 2. It is a poverty measure, which is sensitive to the income distribution among the poor – the worse this distribution is, the more severe poverty is.
Subsistence incidence - the proportion of families/individuals with per capita income less than the per capita food threshold to the total number of families/ individuals.
Philippine Statistics Authority
Annex Tables
Source: Philippine Statistics Authority


