

Release Date :
Reference Number :
2019-SR61-014
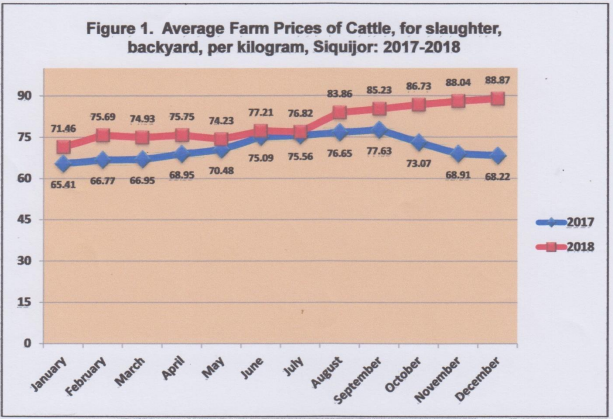
Farmgate Prices of Cattle, For Slaughter, Backyard
The average farmgate prices of cattle, for slaughter, backyard was consistently higher in 2018 compared with its prices in 2017. The highest increase was noted in December with a price increment of 30.27 percent or from Ᵽ68.22 per kilogram in December 2017 to Ᵽ88.87 per kilogram in December 2018. The lowest increase, however, was noticed in July with a price increase of only 1.67 percent or from Ᵽ75.56 per kilogram in July 2017 to Ᵽ76.82 per kilogram in 2018. (See figure 1.)
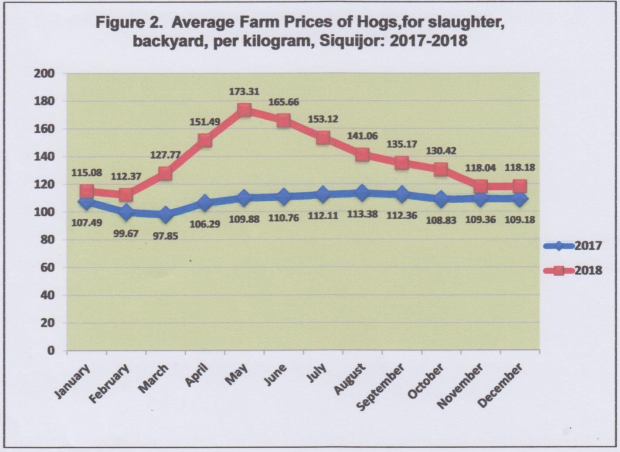
Farmgate Prices of Hogs, For Slaughter, Backyard
The average farmgate prices of hogs, for slaughter, backyard in 2018 went high compared with its prices in 2017. Comparing the prices between 2017 and 2018, the highest price difference was recorded in May with 57.73 percent price increment. In 2017, its average farm gate price was only Ᵽ109.88 per kilogram, while in 2018, it moved up to Ᵽ173.31 per kilogram. However, the lowest price difference was recorded in January with 7.59 percent price increment. From its record in 2017 of Ᵽ107.49 per kilogram, it moved up only to Ᵽ115.08 per kilogram in 2018. (See figure 2.)
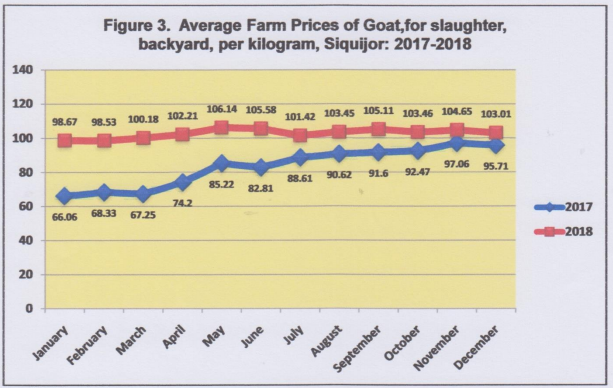
Farmgate Prices of Goat, For Slaughter, Backyard
Farmgate prices of goat from January to December in 2018 all increased compared to January-December in 2017. Price with the highest increment was noted in January. Its average price in 2017 was only Ᵽ66.06 per kilogram and it moved up to Ᵽ98.67 per kilogram in 2018. The month of December was noted to have the lowest record of price increment with prices movement from Ᵽ95.71 per kilogram in 2017 to Ᵽ103.01 per kilogram in 2018. (See figure 3.)
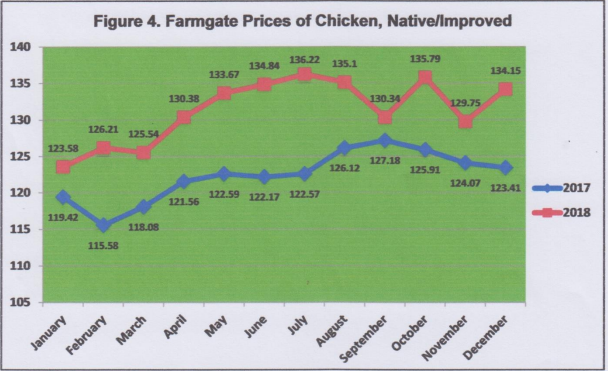
Farmgate Prices of Chicken, Native/Improved
Farmgate prices of chicken, native/improved continuously increased in 2018 over 2017. The highest record was in July with an average price of Ᵽ136.22 per kilogram. (See figure 4.)
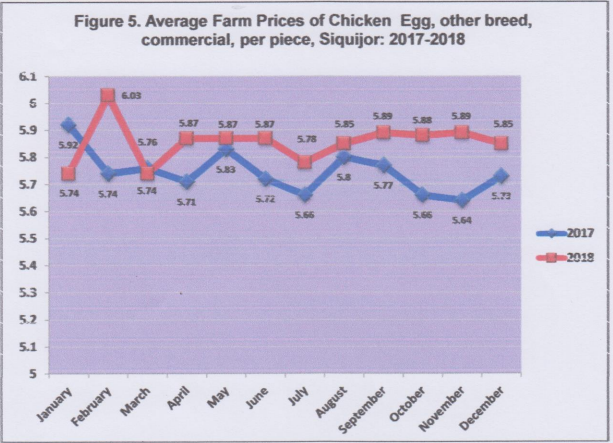
Farmgate Prices of Chicken Eggs, Other Breed, Commercial
The average farmgate prices per piece of chicken eggs, other breed, commercial moved up every month in 2018 (except for the months of January and March) compared to its monthly average farmgate prices in 2017. In February, its price increased by 5.05 percent (from Ᵽ5.74 per piece in 2017 to Ᵽ6.03 per piece in 2018), the highest recorded increase comparing the months in 2018 and 2017. However, its prices in January and March 2018 decreased by 3.04 percent and 0.35 percent, respectively compared to the same months in 2017. (See figure 5.)
TECHNICAL NOTES
Prices received by farmers for crops, livestock and poultry are the farmers’ selling prices for their produce at the first point of sale. These prices depend on the place of sale which may be within the production site, at the wholesale market or other areas. At each point of sale, every respondent will be asked the volume sold and freight cost in marketing their product. If a farmer marketed several times during the reference period, the latest quantity sold and prices obtained are reported. Commodities monitored by province are pre-determined based on four (4) criteria, namely:
1. major produce of the province in terms of volume of production
2. priority crop of the province
3. national commodity and the province is one of the major producers
4. Producers’ Price Index (PPI) commodity Determination of the agricultural commodities to be monitored for farm prices shall be done at the Provincial Statistical Office (PSO).
RATIONALE
The availability of marketing information in the farm prices is an essential factor not only in the formulation of economic programs and policies but also in the production process of agricultural commodities. This most benefits, among others, the farmers in the stage of production planning and decision-making with regard to optimizing their profit.
OBJECTIVES
The general purpose of the Farm Prices Survey (FPS) is to gather reliable price information at the farm level. The specific objectives are:
1) to generate estimates on farmgate prices of major agricultural commodities;
2) to develop sets of price indices and to measure the purchasing power of growers of selected agricultural products;
3) to analyze the seasonal trends and variations in agricultural prices;
4) to serve as input for forecasting future supply, demand and prices of agricultural commodities;
5) to assist policy makers in the formulation, implementation and administration of economic programs; and
6) to guide farmers/raisers in their decision making relative to their agricultural activities geared towards improvement of their profitability.
FREQUENCY OF DATA COLLECTION
Collection of data is done monthly, during the last 10 days of the month. The reference period is days 1 to 30 of the reporting month.
(SGD.) FELICISIMO B. VALIOS
Supervising Statistical Specialist/
Officer-in-Charge
| Attachment | Size |
|---|---|
|
|
2.06 MB |