

Release Date :
Reference Number :
2019-SR61-012
Siquijor CPI increases at 125
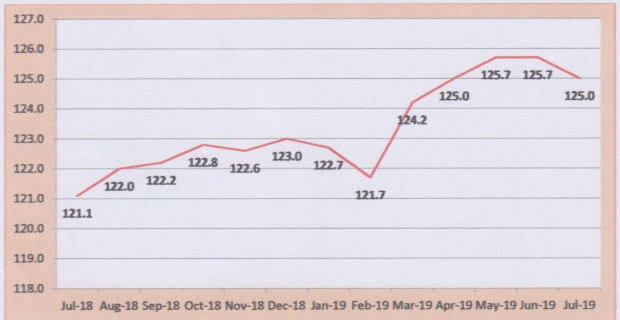
Survey of Retail Prices of Commodities conducted by Philippine Statistics Authority (PSA) has generated a CPI of 125 as of July 2019, using 2012 as the base year. But had a decrease of 0.7 from June 2019 which posted a CPI of 125.7. During the same period in 2018, the CPI was at 121.1. This implied that the cost of a basket of goods and services commonly purchased by typical Filipino households in Siquijor was at an average of P125 during the period.
Price indices are used for economic analysis and as a monitoring indicator of government’s economic policy. CPI is most widely used in the calculation of the inflation rate and purchasing power of peso. It is an indicator of the changes in the average retail prices of a fixed basket of goods and services commonly purchased by households relative to the base year.
Table 1. Consumer Price Index (CPI) by Commodity Group: Siquijor (2012=100)
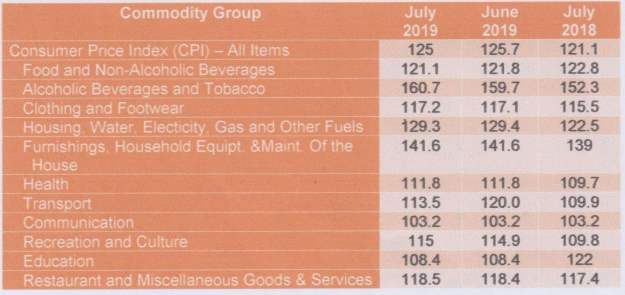
In July 2019, commodities under Alcoholic Beverages and Tobacco had the highest CPI at 160.7 (See Table 1). This was followed by the commodity group of Furnishings, Household Equipment and Maintenance of the Households (141.6) and Housing, Electricity, Gas and other Fuels (129.3). The rest of the commodity groups had CPI lower than the provincial average. The three lowest CPI were, Communication (103.2), Education (108.4) and Health (111.8).
Figure 1: Consumer Price Index (CPI) for all Items: Siquijor, July 2018 to July 2019
Siquijor Province Inflation is down by 3.2% in July 2019
Inflation Rate is the rate of change of the CPI expressed in percent. Inflation is interpreted in terms of declining purchasing power of peso.
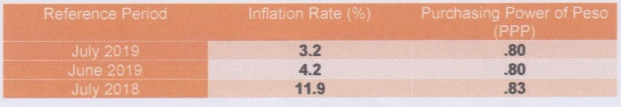
Siquijor inflation in July 2019 decreased slightly by 3.2% from the previous month at 4.2%. It also decreased from the same period in 2018 with an inflation of 11.9% in July 2018. The purchasing power of peso in the province remained at 80 centavos lower from last year same period at 83 centavos. See Table 2 below.
Table 2. Year on Year Inflation Rate (All Items) and Purchasing Power of Peso (2012=100)
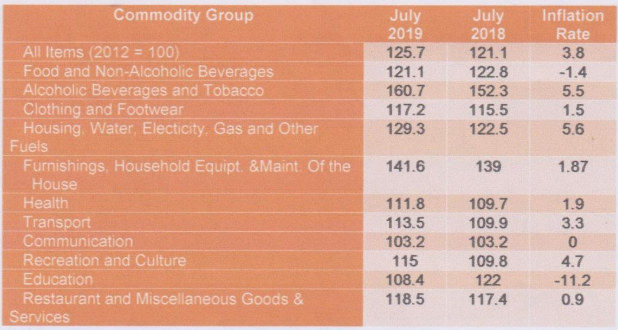
The slow decrease of inflation was mainly driven by the commodity groups of Education (-11.2%) and Food and Non-Alcoholic Beverages (-1.4%). See Table 3.
Table 3. Consumer Price Index (CPI) and Inflation Rates by Commodity Group: Siquijor (2012=100)
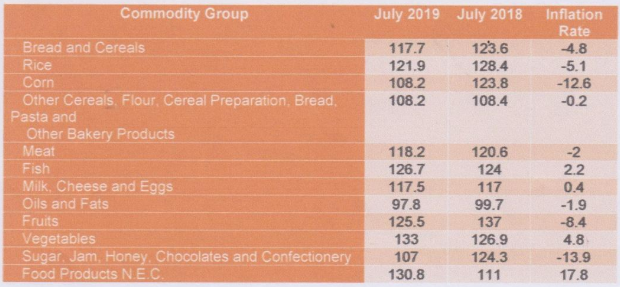
On the selected food items, highest increase was recorded in Food Products N.E.C. at 17.8%. But other food groupshave remarkabledecrease in July 2019 that contributed to the decrease of CPI. These are the following:
· Sugar, Jam, Honey, Chocolates and Confectionery (-13.9%)
· Corn (-12.6%)
· Fruits (-8.4%)
· Rice (-5.1%)
· Bread and Cereals (-4.8%)
· Meat (-2.0)
See Table 4 for the complete list of inflation rates of selected food items.
Table 4. Consumer Price Index (CPI) and Inflation Rates of Selected Food Items: Siquijor (2012=100)
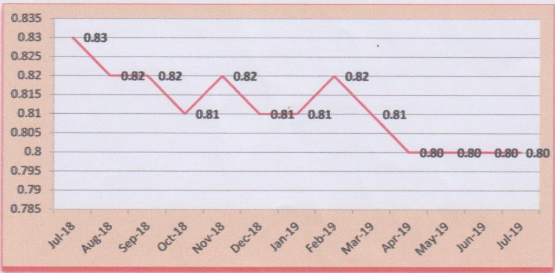
Purchasing Power of Peso (PPP) remains at 0.80
Purchasing Power of Peso (PPP) shows how much the peso in the base period is worth in the current period. It is computed as the reciprocal of the CPI for the period under review multiplied by 100. The PPP is inversely related to inflation rate. Thus, as the inflation rate increases, PPP declines.
The PPP in July 2019 was 0.80. This implied that the Php 1.0 in 2012, as the base year, values only at Php 0.80 in July 2019. The same PPP was recorded in June 2019. See Figure 2.
Figure 2: Purchasing Power of Peso (PPP): Siquijor, 2012 = Php 1.00
(SGD.) AURELIA M. CANDA
Chief Statistical Specialist
| Attachment | Size |
|---|---|
|
|
1.33 MB |