

Release Date :
Reference Number :
2022-SR46-004
Negros Oriental Household Cereal Stocks
As of 6:00am Every First day of January - December 2021
Higher stocks level for cereals recorded in January-March 2021
Total combined household rice and corn stock level monitored every first day of the month at 6 o’clock in the morning of January, February and March recorded 74,704 metric tons. Of which, 42.84 thousand metric tons are in rice form and another 31.86 thousand metric tons in corn grain form. Fifty-seven percent of the total cereal stocks is rice while the remaining forty-three percent is corn grain. Total Household stocks recorded in this quarter is 9.56 percent greater compared to the same quarter in 2020.
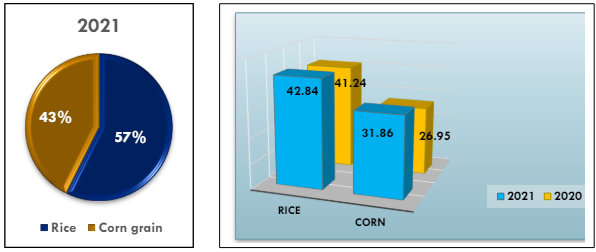
Table 1 & 2. Percentage share and Total Household stock level as 6:am every 1st day of January-March 2021 vs. 2020, Neg. Oriental
(In ‘000 metric ton)
Source: PSA PCSS1 Survey
Household stocks level for cereals down in April-June 2021
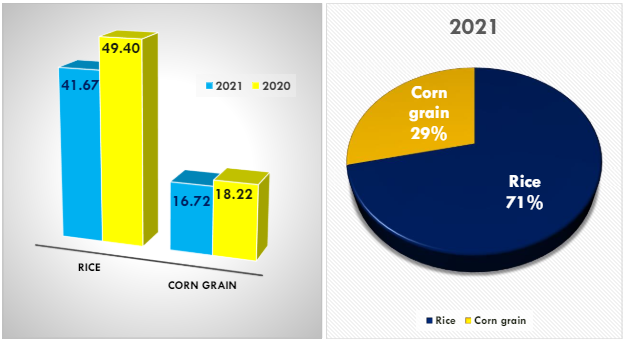
Table 3 & 4. Total Household stock level and Percentage share as 6am every 1st day of April -June 2021 vs. 2020, Neg. Oriental
(In ‘000 metric ton) Source:
PCSS1 Survey PSA,
Combined household stocks monitored as of 6:00 am every 1st day of April, May, and June this year dropped to 58,387 metric tons of rice and corn grain. This is a 13.65 per cent drop compared to combined stock volume of the first days of the same period last 2020. At 16.72 thousand metric tons Corn grain stock shared 29 per cent share of the total cereal stocks while rice bagged a 71 per cent share equivalent to 41.67 thousand metric tons.
Rice stocks level drained 15.65 per cent in volume compared to same reference period in 2020 while corn grain lost 8.23 per cent. Decrease in the volume of household stocks is attributed to rapid disposal of stocks and harvested grains by farmers as grains prices are pre-empted to fall to a lower level due to the Rice Tariffication Law.
July – Sept 2021 Household stocks level for cereals bolstered at 50.17 percent. 
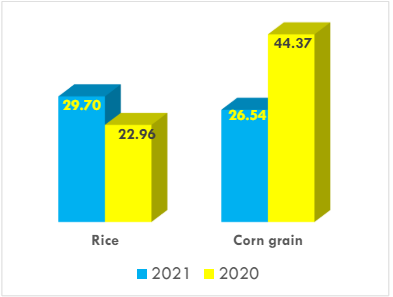
Table 5. Household stock level as 6:am every 1st day of July - Sept 2021 vs. 2020, Neg. Oriental
(In metric ton)
Source: Farm Price Survey PSA,
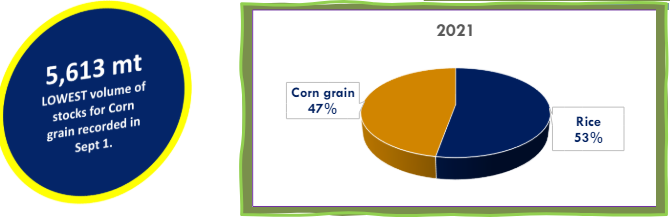
Table 5. Percentage share of Total Household stock level as of 6:am every 1st day of Jul - Sep 2021
vs. 2020, Neg. Oriental
(In metric ton)
Source: PCSS1 Survey PSA,
For the 3rd Quarter of 2021, Rice is the majority shareholder of 53 percent of the combined total household stocks, Corgrain got the remaining 47 per cent of the total volume. This change in scenario was due to the huge decrease in corn land harvest area in the province which lost more than 1,900 hectares over the 2020 harvests level.
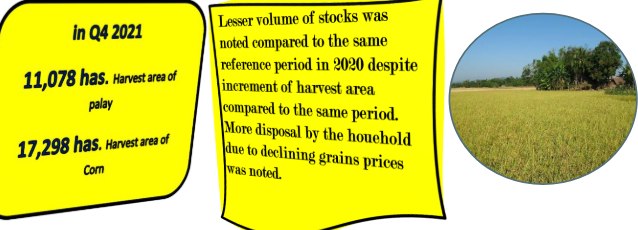
Palay area harvested of which most of the households derive the stocks topped 439 hectares more compared to the same quarter last 2020. This period records the lowest volume level of rice found in the households at only 5,613 metric tons.
Lesser Household stocks level for cereals in Quarter 4 2021
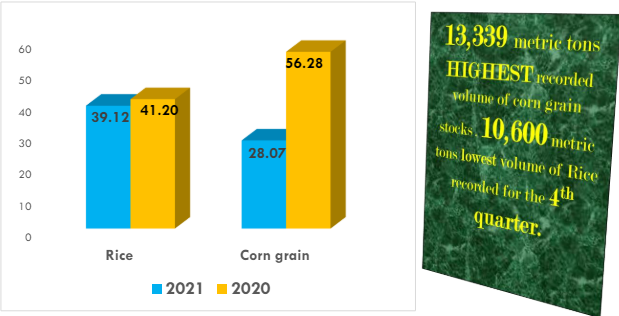
Table 6. Total Volume of Household stock as 6 am every 1st day of Oct - Dec 2021 vs. 2020, Neg. Oriental
(In metric ton)
Source: PCSS1 Survey PSA,
Cereals Household Stocks as of 6:00 o’clock in the morning in the first day of October, November and December 2021 summed up to a combine volume of 67.19 thousand metric tons. Rice stocks recorded a majority share of 58.22 per cent while Corn grain stocks retained the minority share of 41.78 percent.
Lower Household grains stock noted this year
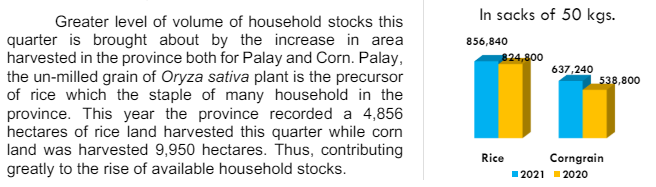
Comparing the combined volume of stocks tallied in the twelve (12) reference days of the year, both rice and corn grain stocks dropped to a lower level compared to the same reference days in 2020. This year, the total volume of cereals tallied reached 256.52 thousand metric tons, 14.67 percent lower than its previous years’ level of 300.63 thousand metric tons. This 2021, in terms of sacks of 50-kilo grams, rice stocks found in households during specific dates of the month reached 3,066,680 sacks, while corn grain recorded 2,063,860 sacks.
Over the months of 2021, the 3rd quarter recorded the least stocking volume of 56.24 thousand metric tons while the 1st quarter also recorded the highest level of 74.70 thousand metric tons for both rice and corn grain.
N.B.
Figures referring to harvest area in this article are sourced from Openstat of the PSA website
SGD
ARIEL T. FORTUITO
Chief Statistical Specialist
| Attachment | Size |
|---|---|
|
|
889.83 KB |