

Release Date :
Reference Number :
2020-SR61-004
Total Population of Enrique Villanueva in 2015 is 6,104
· The total population of the Municipality of Enrique Villanueva, Siquijor as of August 1, 2015 was 6,104 based on the 2015 Census of Population (POPCEN 2015).
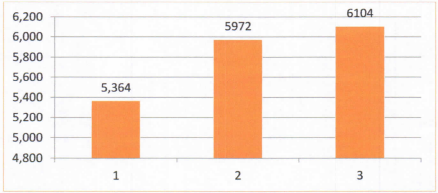
· The 2015 population is higher by 132 compared with the population of 5,972 in 2010, and by 740 compared with the population of 5,364 in 2000. Refer to Table 1 and Figure 1 for the comparison of population by censal year.
Table 1. Population of Enrique Villanueva, Siquijor
(Based on the 2000, 2010, and 2015 Censuses)
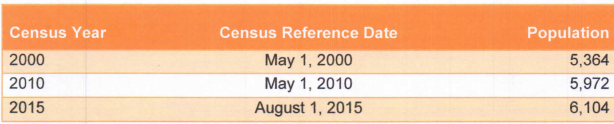
Figure 1. Population of Enrique Villanueva
(Based on the 2000, 2010, and 2015 Censuses)
Enrique Villanueva continues to decrease its growth rate
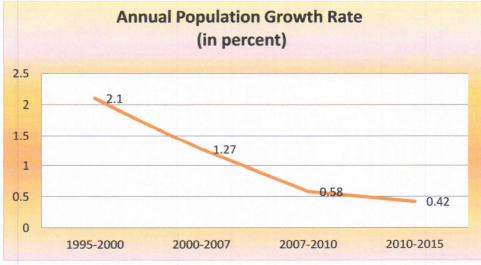
· The population of Enrique Villanueva increased by 0.42 percent annually, on average, during the period 2010 to 2015. By comparison, the rate at which the province’s population grew during the period 1995 to 2000 was higher at 2.10 percent but it was slowly decreasing on the succeeding censuses with an average annual growth rate of 1.27 in 2000 to 2007 and 0.58 in between 2007 to 2010. See Table 2 and Figure 2 for the Annual growth rate in different censuses.
Table 2. Annual Growth Rate of Enrique Villanueva
(Based on the 2000, 2007, 2010, and 2015 Censuses)
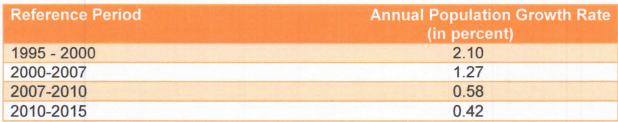
Figure 2. Annual Growth Rate of Enrique Villanueva
Enrique Villanueva is the smallest among 6 municipalities
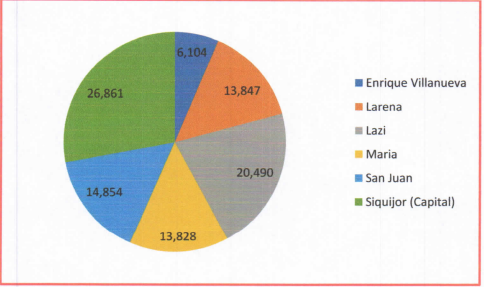
· Municipality of Enrique Villanueva is the smallest among the six municipalities of Siquijor Province in terms of land area and population. It has a total land area of 25.39 square kilometres with a total population of 6,104. It is only 6.36 percent of the total population of Siquijor Province which was 95,984 in 2015 POPCEN. See Table 3 for the complete list of population by municipality and Figure 3 for the graph of the municipal population.
Table 3. Population of Siquijor Province by Municipality
(Source: POPCEN 2015)
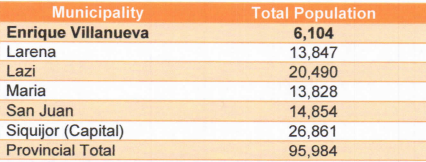
Figure 3. Population of Siquijor Province by Municipality in Pie Graph
(Based on POPCEN 2015)
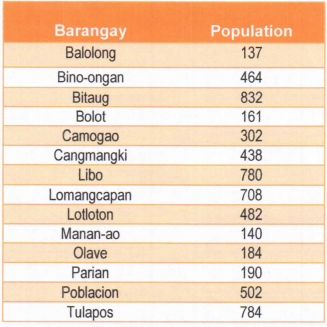
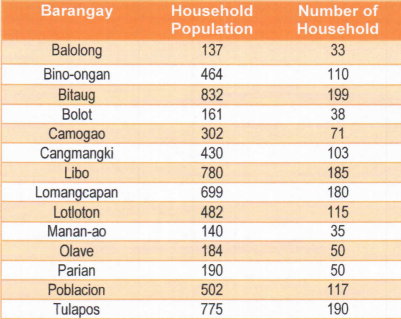
· Municipality of Enrique Villanueva is composed of 14 barangays. The smallest barangay in terms of population is Balolong, located in the mountainous part of the municipality. The largest barangay is Tulapos with a total population of 784. It is a coastal barangay of the municipality in which the national highway is located. See Table 4 for the complete list of barangays and its population.
Table 4. Total Population of Enrique Villanueva by Barangay
(Source: POPCEN 2015)
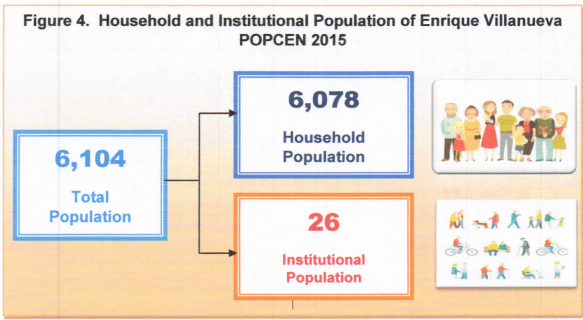
Household Population comprised 99.57 percent of the total population
· The household population of Enrique Villanueva reached 6,078 persons in 2015. The recorded institutional population is 26. Thus, the household population comprised 99.57 percent of the total population while the remaining 0.43 is comprised of the institutional population. Please refer to Figure 1 for the illustration of the household and institutional population.
Number of households increased by 44 from 1,432 in 2010 to 1,476 in 2015
· The total number of households in the province in 2015 was recorded at 1,476 higher by 44 households compared with 1,432 in 2010. It increased by 3.07 percent from 2010 to 2015. Barangay Balolong has the least number of households with 33. The biggest number is Barangay Bitaug with 199 households in 2015. See Table 5 for the complete list of barangays and its number of households.
Table 5. Household Population and Number of Households of Enrique Villanueva by Barangay
(Source: POPCEN 2015)
Average household size was 4.12 persons in 2015
· Average household size (AHS) in the Municipality of Enrique Villanueva decreased from 4.29 persons in 2010 to 4.12 persons in 2015. This is lesser than the provincial average of 4.19 in 2015. Average household size can be computed by diving the household population by its number of household.
Technical Notes
The 2015 Census of Population (POPCEN 2015) was undertaken by the Philippine Statistics Authority (PSA) in August 2015 as mandated by Republic Act No. 10625, otherwise known as the Philippine Statistics Act of 2013. It was the 14th Census of Population that was undertaken since the first census in 1903. POPCEN 2015 was designed to take an inventory of the total population all over the Philippines and collect information about their characteristics. Census day for the POPCEN 2015 was August 1, 2015 (12:01 a.m.). POPCEN 2015 made use of the de jure concept of enumeration wherein households and persons are enumerated in the area where they usually reside as of the census reference date. Enumeration lasted for about 25 days, from 10 August to 6 September 2015. Enumeration was extended until 15 September 2015 for large provinces and some highly urbanized cities.
Definition of Terms
Household is a social unit consisting of a person living alone or a group of persons who sleep in the same housing unit and have a common arrangement in the preparation and consumption of food.
Institutional Population comprises of persons who are found living in institutional living quarters.
Average household size the average number of persons who live in the household, computed as the household population in a given area divided by the corresponding total number of households in that area.
(SGD.) AURELIA M. CANDA
Chief Statistical Specialist
| Attachment | Size |
|---|---|
|
|
3.1 MB |