

Release Date :
Reference Number :
2020-SR61-015
Population of San Juan in 2015 reached 14,854
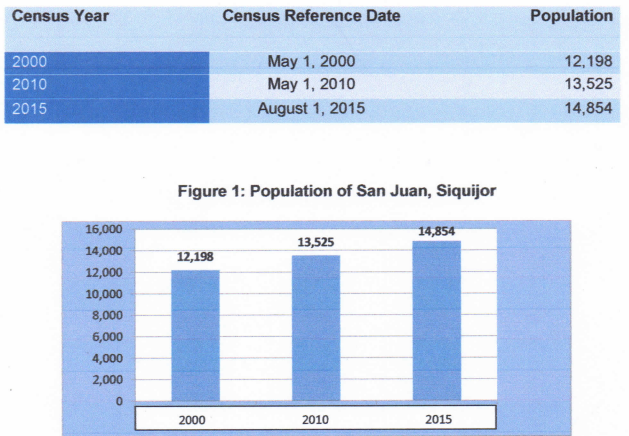
The population of the Municipality of San Juan, Siquijor as of August 1, 2015 reached 14,854 based on the 2015 Census of Population (POPCEN 2015).
The 2015 population is higher by 1,329 compared with the population of 13,525 in 2010, and by 2,656 compared with the population of 12,198 in 2000. Refer to Table 1 and Figure 1 for data comparison by censal year.
Table 1. Population of San Juan, Siquijor
(Based on the 2000, 2010 and 2015 Censuses)
Figure 1: Population of San Juan, Siquijor
Annual Growth Rate (AGR) of San Juan increased in 2010-2015
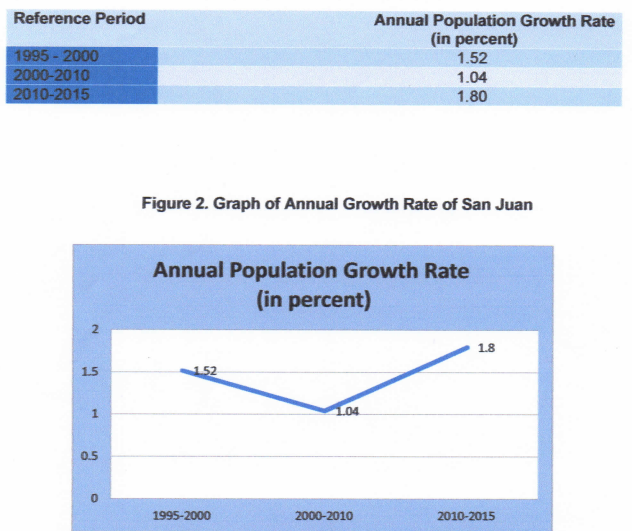
The population of San Juan increased by 1.80 percent annually, on average, during the period 2010 to 2015. By comparison, the rate at which the province’s population grew during the period 2000 to 2010 was lower at 1.04 percent. During years 1995 to 2000 the annual growth rate was 1.52.
San Juan was the fastest growing population during 2015 census with its annual growth rate at 1.80. See Table 2 and Figure 2 for the comparison of the annual growth rate by different censuses.
Table 2. Annual Growth Rate of San Juan
(Based on the 2000, 2010 and 2015 Censuses)
Figure 2. Graph of Annual Growth Rate of San Juan
By population, San Juan is the third biggest in Siquijor Province
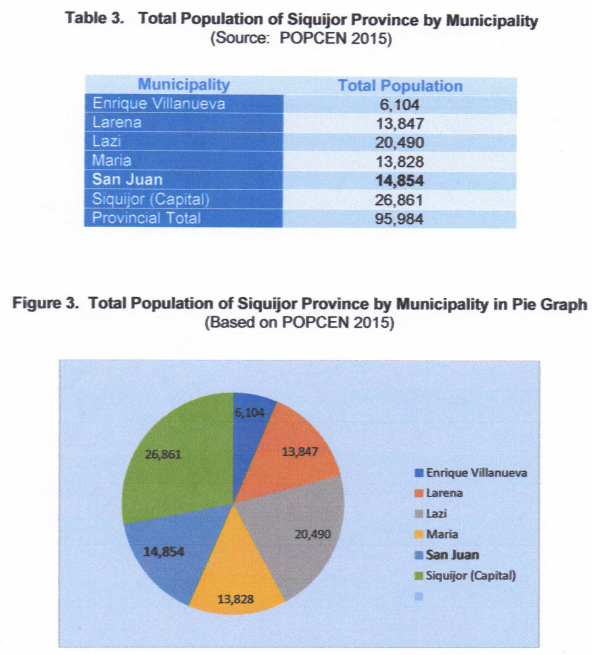
Municipality of San Juan is fourth largest municipality of Siquijor Province in terms of land area which is 44.37 square kilometres.
By population it is the third biggest with 14,854 total populations in 2015. See Table 3 for the complete list of population by municipality and Figure 3 for the graph of the municipal population.
Table 3. Total Population of Siquijor Province by Municipality
(Source: POPCEN 2015)
Figure 3. Total Population of Siquijor Province by Municipality in Pie Graph
(Source: POPCEN 2015)
Six barangays have more than 1,000 populations
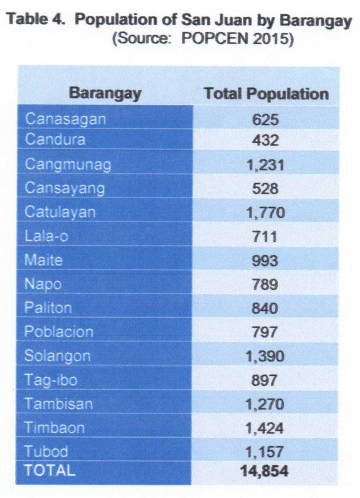
Municipality of San Juan is composed of 15 barangays. The smallest barangay in terms of population is Candura with 432 persons followed by Cansayang with 528 persons.
Six barangays have population count of more than 1,000 in which barangay Catulayan has the highest population count with 1,770 persons.
See Table 4 for the complete list of barangays and its population.
Table 4. Population of San Juan by Barangay
(Source: POPCEN 2015)
San Juan was the only municipality without institutional population
Municipality of San Juan has a household population of 14,854 in 2015. This means that the total population is equal to the household population and no institutional population was enumerated in 2015. Thus, the household population comprised 100 percent of the total population. Please refer to Figure 1 for the illustration of the household and institutional population.
Number of households increased by 319The total number of households of Municipality of San Juan in 2015 was recorded at 3,579 higher by 319 households compared with 3,260 in 2010. It increased by 9.78 percent from 2010 to 2015.
Least number of households is Barangay Candura with 100 followed by Cansayang with 127. These two barangays are mountainous part of the municipality.
Barangay Catulayan has the biggest number of households with 428. It was followed by Solangon with 340 and Timbaon with 338. Catulayan was divided into two enumeration areas during 2015 census due to its numerous households.
See Table 5 for the complete list of barangays and its corresponding number of households.
Table 5. Household Population and Number of Households by Barangay
Municipality of San Juan, Siquijor
(Source: POPCEN 2015)

Average household size was 4.15 persons in 2015
Average household size (AHS) in the Municipality of San Juan increased from 4.10 persons in 2010 up to 4.15 persons in 2015. This means that there are 4 to 5 persons who live in a household on the average. The AHS of 4.15 is lower than the provincial average of 4.19 in 2015.
Technical Notes
The 2015 Census of Population (POPCEN 2015) was undertaken by the Philippine Statistics Authority (PSA) in August 2015 as mandated by Republic Act No. 10625, otherwise known as the Philippine Statistics Act of 2013. It was the 14th Census of Population that was undertaken since the first census in 1903. POPCEN 2015 was designed to take an inventory of the total population all over the Philippines and collect information about their characteristics. Census day for the POPCEN 2015 was August 1, 2015 (12:01 a.m.). POPCEN 2015 made use of the de jure concept of enumeration wherein households and persons are enumerated in the area where they usually reside as of the census reference date. Enumeration lasted for about 25 days, from 10 August to 6 September 2015. Enumeration was extended until 15 September 2015 for large provinces and some highly urbanized cities.
Definition of Terms
Household is a social unit consisting of a person living alone or a group of persons who sleep in the same housing unit and have a common arrangement in the preparation and consumption of food.
Institutional Population comprises of persons who are found living in institutional living quarters.
Average household size the average number of persons who live in the household, computed as the household population in a given area divided by the corresponding total number of households in that area.
(SGD.) AURELIA M. CANDA
Chief Statisical Specialist
| Attachment | Size |
|---|---|
|
|
4.01 MB |