

Release Date :
Reference Number :
2024-SR12-008
Starting February 2022, the Philippine Statistics Authority (PSA) released the rebased Consumer Price Index (CPI) for all income households to base year 2018, from base year 2012 as announced in the press release number 2022-01 dated 04 January 2022. The CPI series for all income households for January 2022 onwards will be 2018-based.
A. The Philippines
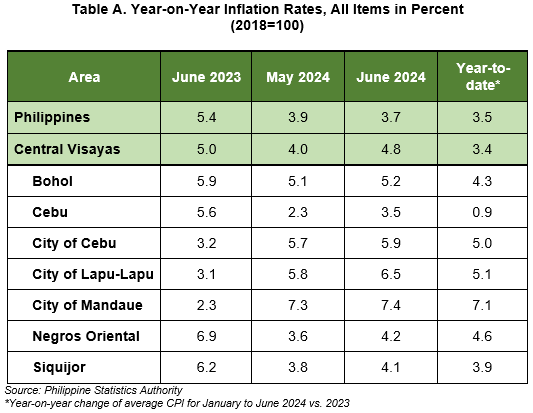
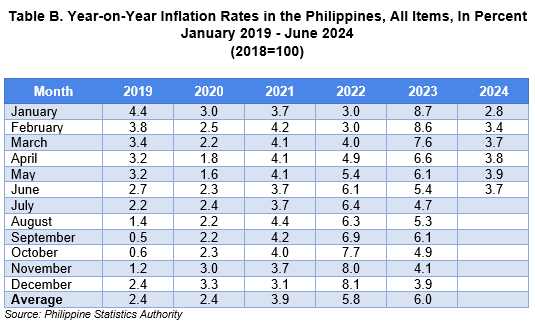
The Philippines’ headline inflation or overall inflation eased to 3.7 percent in June 2024 from 3.9 percent in May 2024. This brings the national average inflation from January to June 2024 to 3.5 percent. In June 2023, inflation rate was higher at 5.4 percent. (Tables A and B)
B. Central Visayas
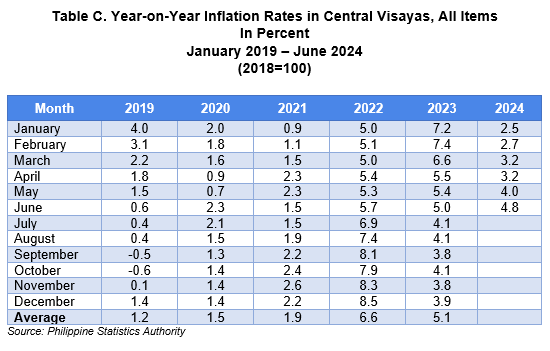
The inflation in Central Visayas accelerated to 4.8 percent in June 2024 from 4.0 percent in May 2024. This brings the regional average inflation from January to June 2024 at 3.4 percent. In June 2023, inflation rate was slightly higher at 5.0 percent.
C. Province of Bohol
1. Headline Inflation
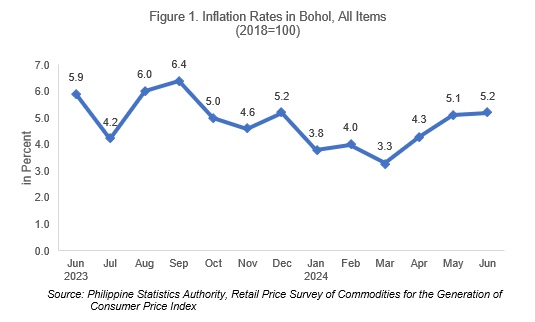
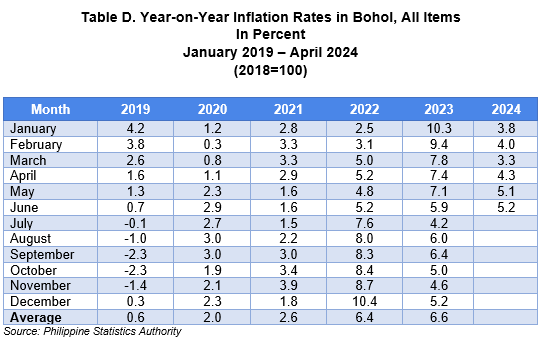
The headline inflation for June 2024 in Bohol increased to 5.2 percent from 5.1 percent in the previous month. This brings the average inflation from January to June 2024 at 4.3 percent. The inflation rate in June 2023 was higher at 5.9 percent. (Table A and Figure 1)
In comparison to national and regional figures, Bohol’s IR in June is higher by 1.5 percentage points than the national and 0.4 percentage points higher than the regional inflation rate. (Table A)
1.1 Main Drivers to the Upward Trend of the Headline Inflation
The uptrend in the overall inflation in June 2024 was primarily influenced by the higher year-on-year increase in the index of housing, water, electricity, gas and other fuels at 2.8 percent during the month from 1.5 percent in May 2024. The faster annual growth of the transport index at 3.2 percent in June 2024 from 2.6 percent in May 2024 also contributed to the uptrend of the overall inflation.
The indices of the rest of the commodity groups registered lower inflation rates in June compared to the previous month except for education services and financial services that retained their inflation rates. (Table E)
1.2 Main Contributors to the Headline Inflation
The top three commodity groups that contributed to the June 2024 overall inflation of 5.2 percent were the following:
a. Food and non-alcoholic beverages with 62.2 percent share or 3.23 percentage points;
b. Housing, water, electricity, gas and other fuels with 11.8 percent share or 0.61 percentage point; and
c. Transport with 7.5 percent share or 0.39 percentage point.
2. Food Inflation
Food inflation at the provincial level declined to 8.7 percent in June 2024 from 9.1 percent in May 2024. In June 2023, food inflation was lower at 8.1 percent.
2.1 Main Drivers to the Downward Trend of Food Inflation
The downtrend in food inflation in June 2024 was primarily influenced by the lower prices of fish and other seafood at -5.0 percent inflation during the month from 1.0 percent in May 2024. Also contributing to the downtrend were the slower annual increases in the indices of meat and other parts of slaughtered land animals with 6.1 percent in June 2024 from 6.6 percent in May 2024, sugar, confectionery and desserts with -11.0 percent inflation in June 2024 from -10.8 percent inflation in the previous month, and flour, bread and other bakery products, pasta products, and other cereals with 3.7 percent inflation in June 2024 from 3.9 percent inflation in the previous month
On the contrary, higher annual growth rates during the month were observed in the indices of the following food groups:
a. Rice at 24.7 percent from 22.2 percent;
b. Oils and fats at 0.5 percent from -0.8 percent;
c. Fruits and nuts at 10.1 percent from 9.5 percent;
d. Vegetables, tubers, plantains, cooking bananas and pulses at 6.7 percent from 5.8 percent; and
e. Ready-made food and other food products n.e.c. 10.6 percent from 9.7 percent.
The food groups corn and milk, other dairy products and eggs retained their previous month’s inflation at 16.3 percent and -0.9 percent, respectively.
2.2 Main Contributors to the Food Inflation
Food shared 61.5 percent or 3.20 percentage points to the overall inflation in June 2024. The following food groups were the top contributors to food inflation during the month:
a. Rice, with 86.9 percent share or 7.56 percentage points;
b. Meat and other parts of slaughtered land animals with 8.6 percent share or 0.75 percentage point; and
c. Vegetables, tubers, plantains, cooking bananas and pulses with 5.1 percent share or 0.44 percentage point.

TECHNICAL NOTES
The Philippine Statistics Authority generates and announces the monthly Consumer Price Index (CPI) based on a nationwide survey of prices for a given basket of goods and services. Two important indicators, the inflation rate and purchasing power of the peso (PPP), are derived from the CPI which are important in monitoring price stability and the value of the country’s currency.
The CPI is an indicator of the change in the average retail prices of a fixed basket of goods and services commonly purchased by households relative to a base year.
Retail Price is the price at which a commodity is sold for spot in small quantities for consumption.
Base Period/Base Year is the period, usually a year, at which the index number is set to 100. It is the reference point of the index number series.
Market Basket is a term used to refer to a sample of goods and services that are commonly purchased and bought by an average Filipino household.
Weight is a value attached to a commodity or group of commodities to indicate the relative importance of that commodity or group of commodities in the market basket.
Inflation Rate is the change in the CPI over a specific period of time (usually a month or a year). That is,
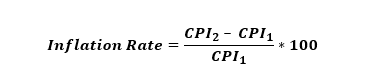
where:
CPI1 - is the CPI in the previous period
CPI2 - is the CPI in the current period
Headline Inflation is the rate of change in the weighted average prices of all goods and services in the CPI basket.
The Purchasing Power of the Peso (PPP) is a measure of the real value of the peso in a given period relative to a chosen reference period. It is computed by getting the reciprocal of the CPI and multiplying the result by 100. That is,

Prepared by:
(SGD.) VENUS P. GLORIA
Statistical Specialist II
Approved by:
(SGD.) JESSAMYN ANNE C. ALCAZAREN
Chief Statistical Specialist
EBG
| Attachment | Size |
|---|---|
|
|
281.56 KB |
|
|
81.83 KB |