

Release Date :
Reference Number :
2021-SR07-020
The Philippine Statistics Authority (PSA) releases the 2015 Municipal and City Level Poverty Estimates1. This set of estimates is part of the output of the Project on the generation of the 2015 Municipal and City Level Poverty Estimates implemented by the PSA and funded by the Government of the Philippines. This is a follow-up study to the earlier projects, which include 1) Poverty Mapping in the Philippines funded through the World Bank (WB) – Asia Europe Meeting Trust Fund, 2) Intercensal Updating of Small Area Poverty Estimates, through the WB Trust Fund for Statistical Capacity Building, and the 3) Project on the Generation of 2006 and 2009 Small Area Estimates of Poverty with funding assistance from the WB, the Australian Government through the Australia – WB Philippines Development Trust Fund and the national government. These projects resulted to the release of 2000, 2003, 2006 and 2009 poverty estimates for municipalities and cities using the small area estimation (SAE) technique. In 2014, the Project on the generation of the 2012 Municipal and City Level Poverty Estimates was already implemented by the PSA which resulted to the release of 2012 small area estimates of poverty.
Similar to the earlier efforts, the SAE methodology employed in the project combined survey and census data to produce reliable poverty estimates at lower levels of geographic disaggregation. The SAE methodology was based on the Elbers, Lanjouw and Lanjouw (ELL) methodology developed by the WB.
Highlights of the 2015 Municipal and City Level Poverty Estimates of Central Visayas
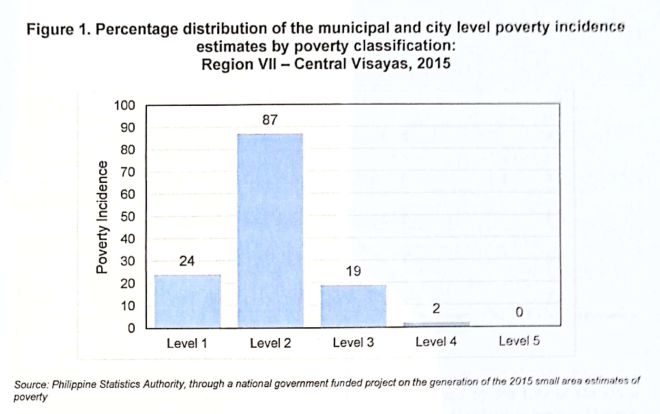
On average, about 18.2 percent of municipalities and cities in Central Visayas are classified in Level 1, which refers to those with poverty incidences of 0.0 percent to 20.0 percent. This is equivalent to 24 municipalities and cities categorized in the Level 1. About 65.9% of municipalities and cities were classified as Level 2 or with estimated poverty incidences between 20.1 percent and 40.0 percent. For Level 3 (poverty incidences range from 40.1 percent to 60.0 percent) and Level 4 (poverty incidences range from 60.1 percent to 80.0 percent), there were about 14.4 percent and 1.5 percent of municipalities and cities that belonged to these groups, respectively. There was no municipality or city that was classified in Level 5 (poverty incidence greater than 80.0 percent). The distribution of the estimated poverty incidence among population for the 132 municipalities and cities in Central Visayas is presented in Figure 1.
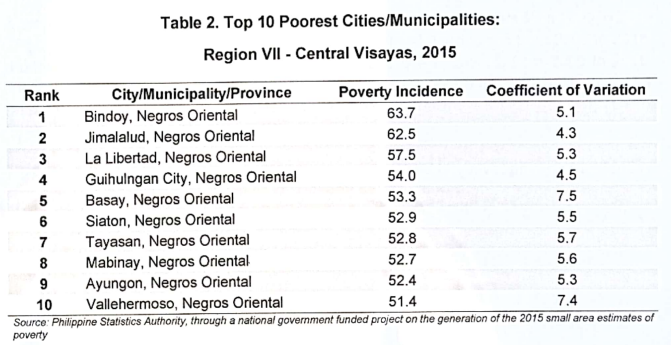
In 2015, the top ten poorest cities/municipalities were all located at the Province of Negros Oriental. The Municipality of Bindoy had the highest poverty incidence among population in Central Visayas with poverty incidence estimated at 63.7 percent. It was followed by the Municipalities of Jimalalud (62.5%) and La Libertad (57.5%), City of Guihulngan (54.0%), Municipalities of Basay (53.3%), Siaton (52.9%), Tayasan (52.8%), Mabinay (52.7%) and Ayungon (52.4%). The Municipality of Vallehermoso ranked tenth among the poorest cities/municipalities in Central Visayas with estimated poverty incidence of 51.4 percent (Table 2).
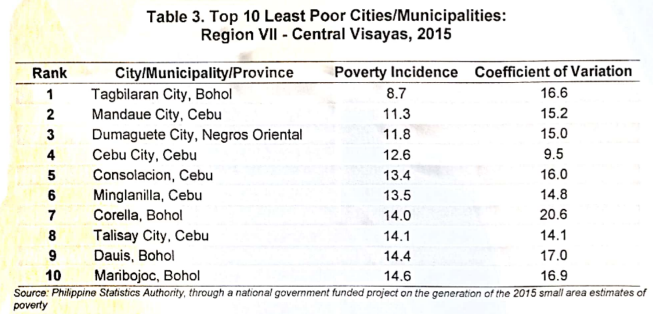
The lowest poverty incidence was estimated in the City of Tagbilaran in the Province of Bohol with poverty incidence estimated at 8.7 percent. It was followed by the City of Mandaue (11.3%) in the Province of Cebu, Dumaguete City (11.8%) in the Province of Negros Oriental and Cebu City (12.6%) in the Province of Cebu. Ranked fifth and sixth with lowest poverty incidence were the Municipalities of Consolacion (13.4%) and Minglanilla (13.5%) in the Province of Cebu. Municipality of Corella (14.0%) in the Province of Bohol, City of Talisay (14.1%) in the Province of Cebu, and the Municipality of Dauis (14.4%) in the Province of Bohol were ranked seventh, eighth and ninth, respectively. Completing the tenth spot was the Municipality of Maribojoc in the Province of Bohol with estimated poverty incidence of 14.6 percent (Table 3).
Comparing graphically the distributions of the estimates across the years from 2009 to 2015 (Figure 2) indicates that there was an increase in the level 2 groupings from 2009 to 2015. Further, there was a decrease in the percentage of those in Level 3 from 2009 to 2015. However, there was a decrease in the percentage of lease poor municipalities and cities or those in the Level 1 from 2012 to 2015.
The poverty map at the municipal and city level estimates by poverty classification also illustrate the same observations as presented in Figure 3. The municipalities and cities were shaded with colors to indicate their poverty classification. It could be noticed that there are more green-shaded areas in Central Visayas for the year 2015 compared to 2009 and 2012. This indicates that the poverty incidences in the municipalities and cities in Central Visayas have been declining since 2009. At the provincial level, however, it can be seen that there were orange-shaded municipalities found in the Province of Negros Oriental indicating high poverty incidence in 2015.
Approved by:
ARIEL E. FLORENDO
Regional Director
| Attachment | Size |
|---|---|
|
|
1.74 MB |