The Provincial Product Accounts (PPA) is a mechanism to compile the Gross Provincial Domestic Product (GPDP).
Complementing the GDP at the national and the regional level, the PPA will provide a suitable measure of economic performance at the provincial/HUC level. It will also be a source of indicators to monitor economic development at the local level.
PPA is also viewed as a means to strengthen the planning- and decision-making of provincial policymakers and stakeholders in crafting more informed economic policies.
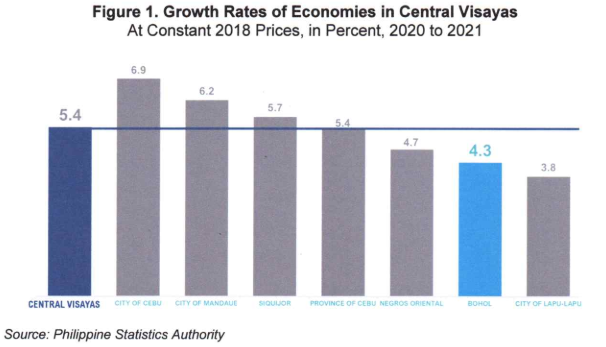
In terms of growth rate, Bohol’s 4.3 percent growth in 2021 is 1.1 percentage points lower than the 5.4 percent growth of the Central Visayas region.
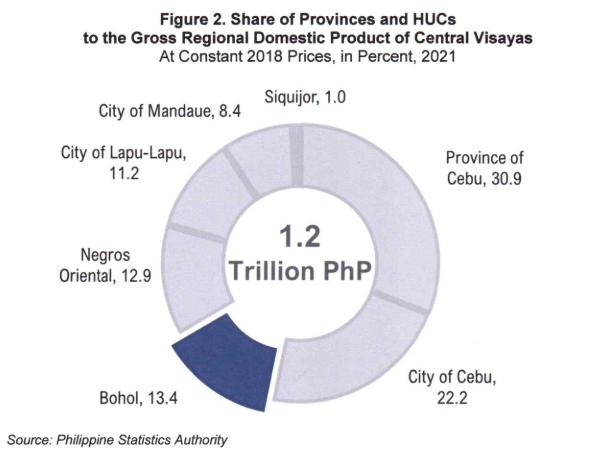
In terms of share, Bohol had the third largest share to the Gross Regional Domestic Product (GRDP) of Central Visayas in 2021 at 13.4 percent.
Of the PhP 1.2 trillion GRDP of Central Visayas in 2021, Bohol contributed PhP 159.9 billion pesos, equivalent to 13.4 percent share. (Figure 2)
The next three figures show the share of the four (4) provinces and three (3) HUCs of Central Visayas to the major industries, namely, Agriculture, forestry, and fishing, Industry, and Services for 2021, at constant 2018 prices.
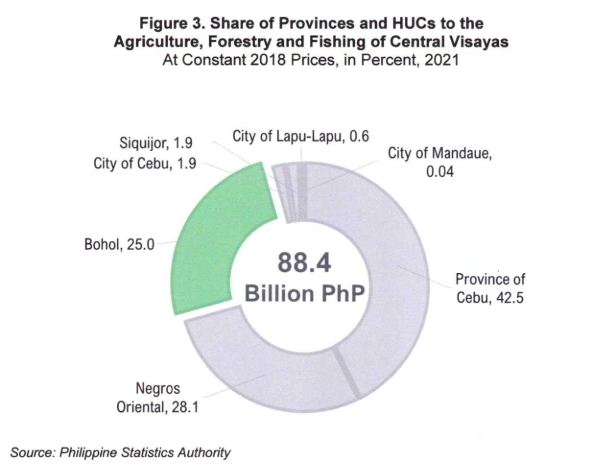
In Agriculture, forestry, and fishing of the Region, Bohol ranked third among the provinces and HUCs, with a share of 25.0 percent. Province of Cebu ranked first at 42.5 percent, and this was followed by Negros Oriental at 28.1 percent. (Figure 3)
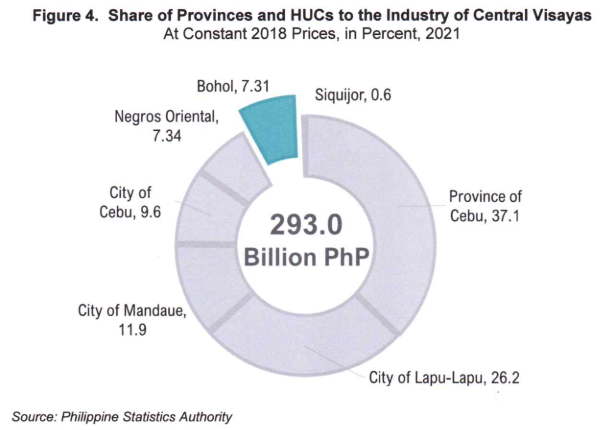
In terms of total Industry, Bohol ranked sixth among the sub-regional economies, having the second lowest share of 7.31 percent to the total Industry of Central Visayas.
Top three largest contributors to the total Industry of Central Visayas in 2021 were: Province of Cebu at 37.1 percent, City of Lapu-lapu at 26.2 percent, and City of Mandaue at 11.9 percent. (Figure 4)
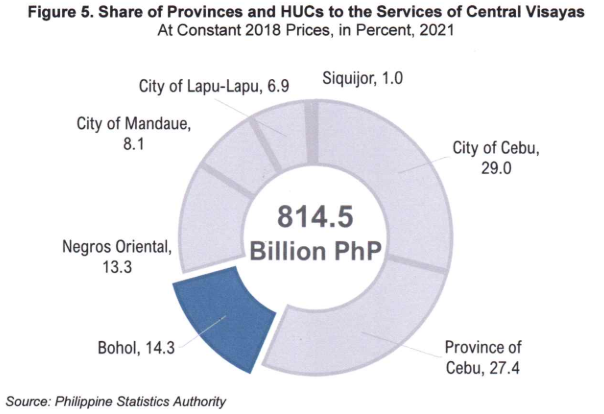
Moreover, Bohol had the third largest share in terms of total Services of the region with 14.3 percent.
City of Cebu had the largest share at 29.0 percent. This was followed by Province of Cebu at 27.4 percent. (Figure 5)
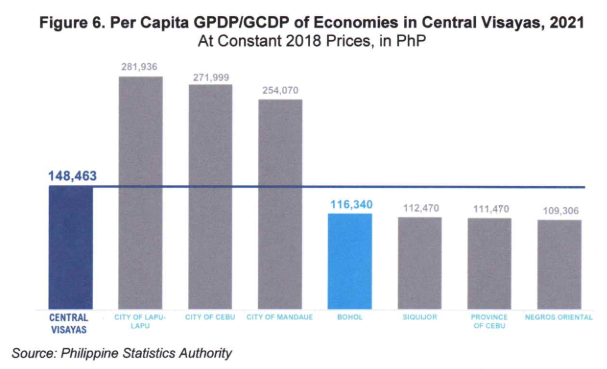
Per capita Gross Provincial Domestic Product (GPDP) is the estimated average contribution of each individual to the total GPDP. It is computed by dividing the GPDP by the total population of the province.
In terms of per capita GPDP, the PhP 116,340 per capita of Bohol in 2021 is 21.6 percent lower than the regional per capita of PhP 148,463. (Figure 6)
TECHNICAL NOTES
The Philippine Statistics Authority (PSA), spearheaded by the Macroeconomic Accounts Service (MAS), and in collaboration with the Regional Statistical Services Offices (RSSOs) and Provincial Statistical Offices (PSOs), rolled out the compilation of Provincial Product Accounts (PPA) for the pilot regions starting 2021.
Last December 2021, Central Visayas, along with MIMAROPA and Northern Mindanao, released the 2018 to 2020 PPA results. To date, 46 provinces and 13 Highly Urbanized Cities (HUCs) released the PPA results. By 2025, the PSA envisions institutionalizing the PPA in all provinces, including the HUCs, of the 17 regions in the country. New group of pilot regions will be added every year to compile the PPA.
PPA is a sub-process of the Philippine System of National Accounts (PSNA) that aims to present a comprehensive picture of the subregional economies.
The GDP at the subregional level is computed by Production Approach. That is, GDP of the province/HUC is measured from the perspective of the producers of goods and services. It covers the value of goods and services produced in the region during the reference period.
In this approach, GDP measures the relative contribution of the 16 industries, namely:
- Agriculture, forestry, and fishing;
- Mining and quarrying;
- Manufacturing;
- Electricity, steam, water and waste management;
- Construction;
- Wholesale and retail trade; repair of motor vehicles and motorcycles;
- Transportation and storage;
- Accommodation and food service activities;
- Information and communication;
- Financial and insurance activities;
- Real estate and ownership of dwellings;
- Professional and business services;
- Public administration and defense; compulsory social activities;
- Education;
- Human health and social work activities;
- Other services.
Descriptions and details of these industries can be found in the Philippine Standard Industrial Classification (PSIC).
Approved for Release:


