The economy of the City of Cebu declined by 10.2 percent in 2020
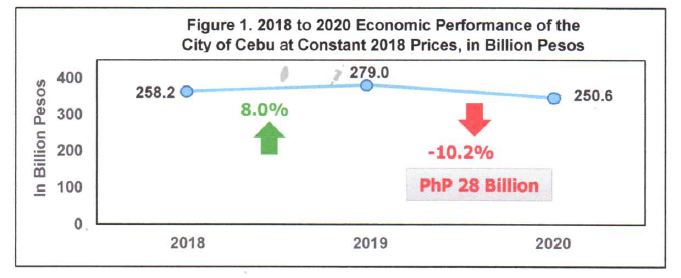
The economy of the City of Cebu declined by 10.2 percent in 2020. The total amount of goods and services produced by the city in 2020 was valued at PhP 250.6 billion. This represents a decline of 10.2 percent from the PhP 279.0 billion in 2019 while in 2018 it was valued at PhP 258.2 billion.
(See Figure 1)
Percentage share of Industries of the City of Cebu
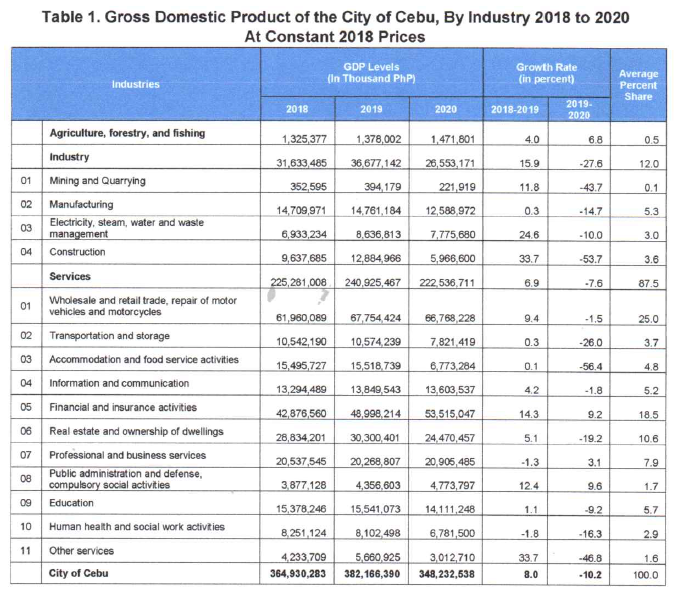
The city’s economy is driven by the following industries: Wholesale and Retail trade; Repair of Motor Vehicles and Motorcycles, Financial and Insurance Activities, and Real Estate and Ownership of Dwellings based on the 2018 to 2020 annual average share of 25.0 percent, 18.5 percent, and 10.6 percent respectively.
In 2019, Agriculture, Forestry and Fishing posted a positive growth of 6.8 percent from 4.0 percent in 2019. Industry and Services posted a negative growth of 27.6 percent and 7.6 percent respectively. Moreover, four industries posted positive growth, these are: Agriculture, Forestry, and Fishing with 6.8 percent, Financial and Insurance Activities with 9.2 percent, Professional and Business Services with 3.1 percent, and Public Administration and Defense; Compulsory Social Activities with 9.6 percent. (See Table 1)
City of Cebu is mainly driven by Services among major industry.
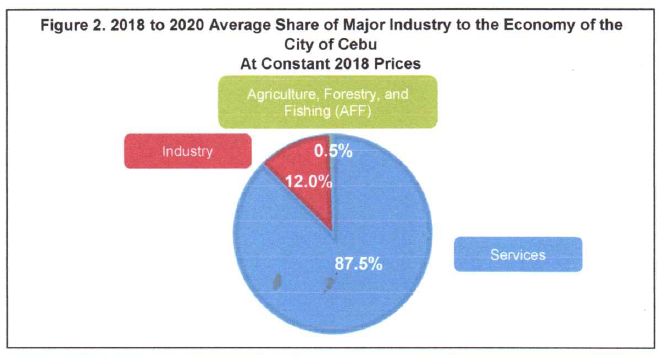
Services has the largest share of the city’s economy accounting to 87.5 percent. This is followed by Industry with 12.0 percent and Agriculture, Forestry and Fishing (AFF) taking 0.5 percent.
(See Figure 2)
Contribution of each industry to the total economy of City of Cebu
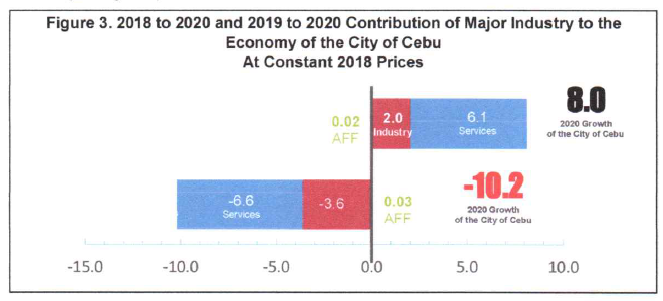
For the contribution of each industry to the total economy of the City of Cebu; in 2019; Services shared 6.1 percentage points to the 8.0 percent increase in 2019. Industry shared 2.0 percentage points and Agriculture, Forestry, and Fishing (AFF) managed to contribute 0.02 percentage points. Meanwhile, in 2020; Services shared a negative -6.6 percentage points to the 10.2 percent decline in 2020. Industry shared -3.6 percentage points while Agriculture, Forestry, and Fishing managed to share the only positive percentage points at 0.03. (See Figure 3)
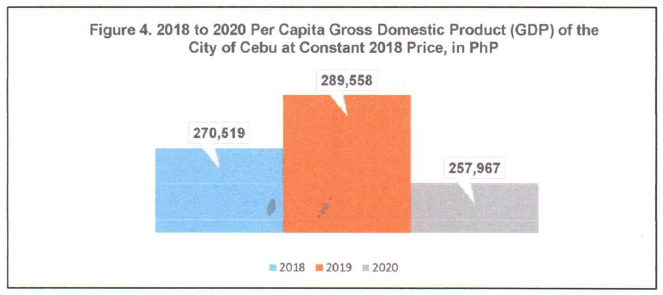
Per Capita Gross Domestic Product of the City of Cebu
In 2018, the Per Capita Gross Domestic Product (GDP) of the City Cebu is at PhP 270,519 while in 2019 it was estimated at PhP 289,558 and in 2020 at PhP 257,967. (See Figure 4)
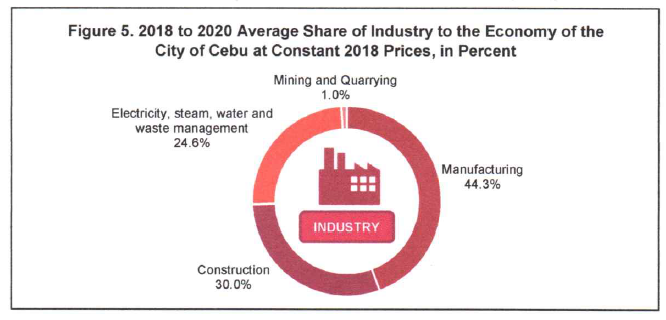
Manufacturing has the largest percentage share of 44.3 percent among Industry
Among Industries, Manufacturing has the largest share of 44.3 percent; followed by Construction with 30.0 percent; Electricity, Steam, Water and Waste Management with 24.6 percent, and Mining and Quarrying with 1.0 percent share. (See Figure 5)
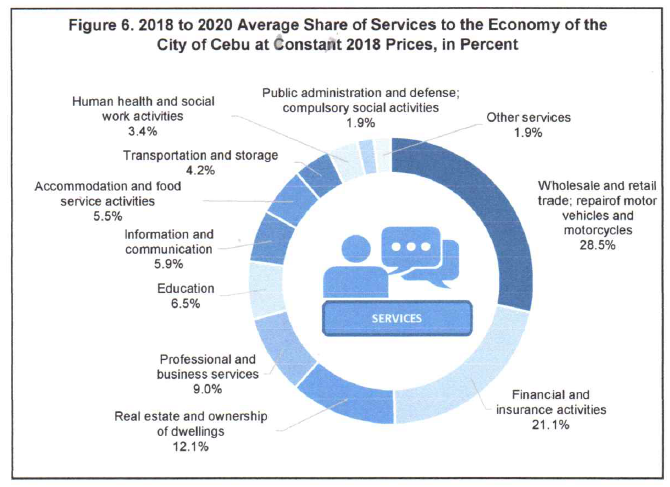
Wholesale and Retail Trade and Repair of Motor Vehicles and Motorcycles has the largest percentage share of 28.5 percent among Services
Among Services, Wholesale and Retail Trade; Repair of Motor Vehicles and Motorcycles had the highest share of 28.5 from 2018 to 2020. This was followed by Financial and Insurance Activities with 21.1 percent. Real Estate and Ownership of Dwellings with 12.1 percent; Professional and Business Services with 9.0 percent Education with 6.5 percent, Information and Communication with 5.9 percent, Accommodation and Food Services Activities with 5.5 percent, Transportation and Storage with 4.2 percent, Human Health and Social Work Activities contributed 3.4 percent, Public Administration and Defense; Compulsory Social Activities and Other Services with 1.9 percent to the Service sector. (See Figure 6)
Technical Notes:
Provincial Product Accounts (PPA) - is a tool used to measure the economic performance of the province or highly urbanized cities (HUCs) at a given time. It monitors the economic development of the province/HUC and evaluates the progress through time. It also serves as a metric to identify which sector or industry that needs intervention for its sustainability in the province’s economy. PPA intends to strengthen the planning and decision-making of provincial policymakers and stakeholders in crafting more informed economic policies and programs.
Gross Domestic Product (GDP) - is a monetary measure of the market value of all the final goods and services produced in a specific time period.
Measuring the Economic Performance
PSA to start the compilation of the Provincial Product Accounts in 2021, initially with 14 provinces from the regions of MIMAROPA (5 provinces), Central Visayas (4 provinces), and Northern Mindanao (5 provinces).
Measurement of GDP – Production Approach
GDP = ∑ Gross Value Added (GVA) of all industries
Gross Value Added*
equals:
Gross Output
less:
Intermediate Consumption
*by taking away Intermediate consumption, GDP represents unduplicated outputs of the economy
Approved by:
(SGD) FIRMO C. DIPUTADO
Chief Statistical Specialist