

Release Date :
Reference Number :
2021-SR61-018
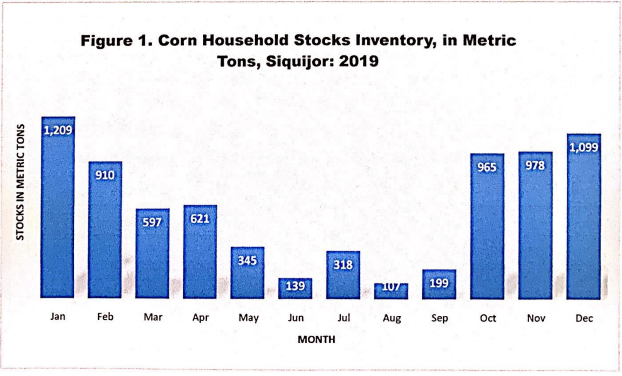
CORN HOUSEHOLD STOCKS INVENTORY, 2019
With a total of 1, 209 metric tons, January 2019 had the highest corn household stock inventory. December came in second with 1,099 metric tons, followed by November with 978 metric tons. The lowest corn household stock inventory was recorded in August, with a total of 107 metric tons.
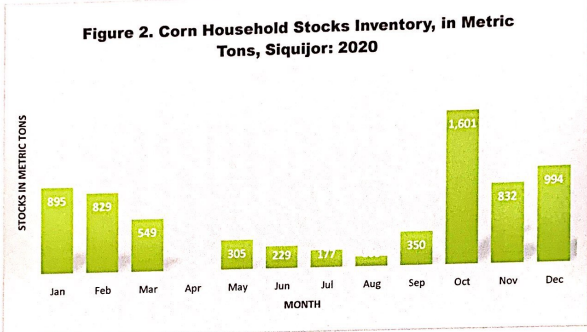
CORN HOUSEHOLD STOCKS INVENTORY, 2020
October of 2020 recorded the highest inventory of corn household stocks which registered a total of 1, 609 metric tons. December and January came in second and third, with 994 metric tons and 895 metric tons, respectively. The lowest inventory of corn household stocks in 2020 which posted at 100metric tons was in August. No survey conducted for the month of April 2020 due to Covid – 19 pandemic.
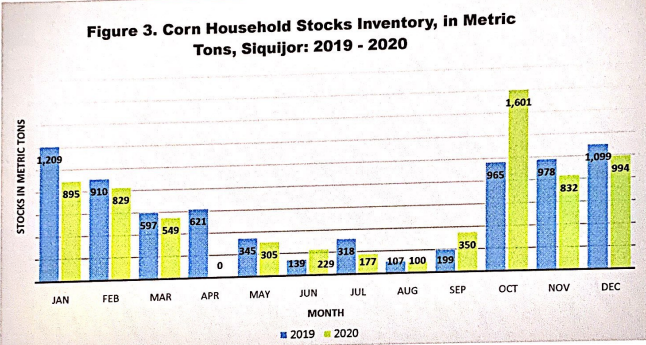
CORN HOUSEHOLD STOCKS INVENTORY, 2019 - 2020
There was a downward trend in household stocks of corn for the most of the months of the year 2020 with an exception of the months of June, September and October that shows an upward trend. However, no data was reported in April of 2020 due to Covid – 19 pandemic.
In January, its record slid down by 314.00 metric tons, or from 1, 209.00 metric tons in 2019 to 895.00 metric tons in 2020. In February, its record declined by 81.00 metric tons, or from 910.00 metric tons in 2019 to 829.00 metric tons in 2020.In March, its record dropped by 48.00 metric tons, or from 597.00 metric tons in 2019 to 549.00 metric tons in 2020. In May, its record decreased by 41.00 metric tons, or from 345.00 metric tons in 2019 to 305.00 metric tons in 2020. In July, its record fell by 141.00 metric tons, or from 318.00 metric tons in 2019 to 177.00 metric tons in 2020. In August, its record went down by 6.00 metric tons, or from 107.00 metric tons in 2019 to 100.00 metric tons in 2020. For the month of November its record slid down by 146.00 metric tons, or from 978.00 metric tons in 2019 to 832.00 metric tons in 2020 while the month of December went down by 106.00 metric tons or from 1, 099.00 metric tons in 2019 to 994.00 metric tons in 2020.
On the other hand, June’s record rose up by 90.00 metric tons, or from 139.00 metric tons in 2019 to 229.00 metric tons in 2020. September’s record went up by 151.00 metric tons, or from 199.00 metric tons in 2019 to 350.00 metric tons in 2020. October’s record leaped by 636.00 metric tons, from 965.00 metric tons in 2019 to 1, 601.00 metric tons in 2021.
TECHNICAL NOTES
The corn stocks inventory is generated from three sectors, namely: household, commercial, and government stocks (National Food Authority). The household stocks are taken from the Palay and Corn Stocks Survey (PCSS) of the PSA, which covers farming and non-farming households nationwide. The commercial stocks are sourced from registered grains businessmen through the Commercial Stocks Survey (CSS) also conducted by the PSA. The government stocks are monitored from NFA warehouses/depositories. The PSA consolidates the stocks inventories from the three sectors which is disseminated monthly through a special release on Rice and Corn Stocks Inventory.
The availability of information on current supply of rice and corn is an essential factor in the formulation of agricultural economic programs and policies on food security. The information is even more relevant due to the frequent occurrence of typhoons and other natural calamities in the country. This prompts the need to monitor stocks situation of the food staples to ensure supply and demand equilibrium, access, and price stability. Thus, the conduct of the stock surveys for palay and corn.
The objective of the survey is to generate estimates on current stock of rice and corn in farming and non-farming households.
The data generated from the survey serve as input in the:
analysis of the seasonal trends and variations in the supply of rice and corn;
forecasting future supply and demand of palay and corn; and
determination of quantity to be imported by government planners for food security purposes.
The information being collected is used to monitor stocks situation of the food staples to ensure supply and demand equilibrium, access, and price stability. Information on stocks holdings can guide policy makers when and how much to import rice especially in time of emergency. It also serves as inputs to the estimation and compilation of national accounts. Moreover, the survey supports the data needs of planners, policy and decision makers, and other stakeholders in the agriculture sector particularly the National Economic and Development Authority (NEDA), National Food Authority (NFA), Department of Agriculture (DA) and its attached agencies such as Philippine Rice Research Institute (PhilRice), Philippine Council for Agriculture and Fisheries (PCAF), and the general public.
(SGD.) AURELIA M. CANDA
Chief Statistical Specialist
| Attachment | Size |
|---|---|
|
|
2.1 MB |