

Release Date :
Reference Number :
2021-SR61-021
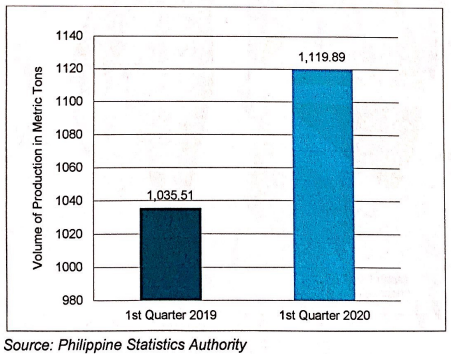
The total municipal fisheries production in Siquijor increased by 8.15 percent from the estimated production of 1,035.51 metric tons in 1st quarter 2019 to 1,119.89 metric tons in 1st quarter 2020 which is mainly attributed to marine municipal fisheries since no inland fisheries activity in the province.
Figure1. Volume of Municipal Fisheries Production Siquijor; 1st Quarter 2019 and 1st Quarter 2020
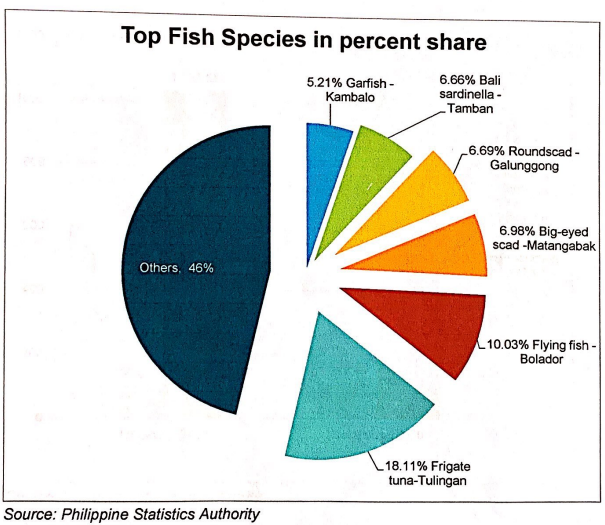
The dominant catch in the marine municipal fisheries of the province in 1st quarter 2020 were Frigate tuna (Tulingan) with 18.11 percent share, Flying fish (Bolador) with 10.03 percent share, Big-eyed scad (Matangbaka) with 6.98 percent share, Roundscad (Galunggong) with 6.69 percent share, Bali sardinella (Tamban) with 6.66 percent share and Garfish (Kambalo) with 5.21 percent share. The above mentioned fish species which contributed to the increase in fish catch during the period was due to its presence and appearance in the municipal sea waters around the island.
Figure 2. Percent Contribution of Top Species to the Total Marine Municipal Fisheries Volume of Production, Siquijor; 1st Quarter 2020
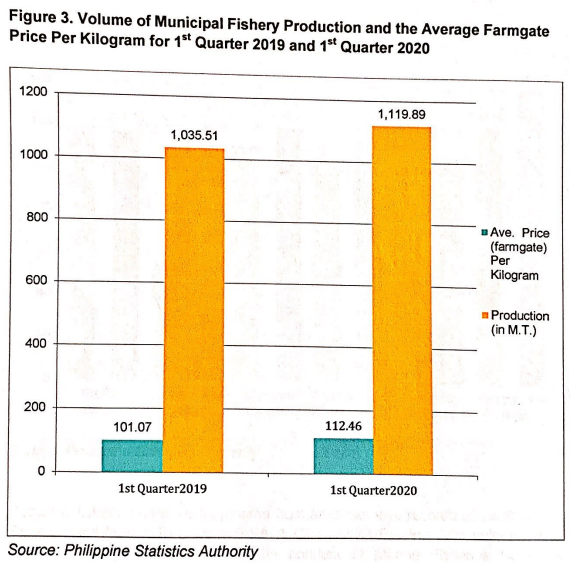
Volume of fish catch on Marine Fishery Production in the province for 1st Quarter 2019 reached to a total of 1,035.51 metric tons and its average (farmgate) Price Per Kilogram pegged at 101.07 while in 1st Quarter 2020, Volume of fish catch on Marine Fishery Production tallied at 1119.89 metric tons with its average (farmgate) Price Per Kilogram at 112.46. Both production and prices in 1st Quarter 2020 recorded an upward trend with 8.15 percent and 11.27 percent increased respectively. More presence of migratory species like big-eyed scad, frigate tuna and roundscad. Appearance of garfish, bali sardinella and flying fish were main contributory factor for the increase in production while the sustained demand from local consumers and in HRIs gave its way to price increase.
Figure 3. Volume of Municipal Fishery Production and the Average Farmgate Price Per Kilogram for 1st Quarter 2019 and 1st Quarter 2020
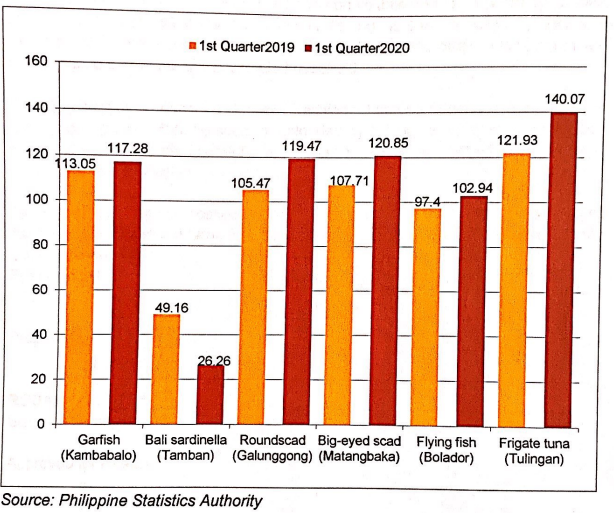
Average prices (farmgate) per kilogram of the top fish species of the Municipal Fishery Production in 1st Quarter 2020 compared with last year’s average price per kilogram. Garfish (kambabalo) at 117.28 in 2020 and 113.05 in 2019; Bali sardinella (tamban) at 26.26 in 2020 and 49.16 in 2019; Rounscad (galunggong) at 119.47 in 2020 and 105.47 in 2019; Big-eyed scad (matangbaka) at 120.85 in 2020 and 107.71 in 2019; Flying fish (bolador) at 102.94 and 97.40 in 2019 and Frigate tune (tulingan) at 140.07 in 2020 and 121.93 in 2019.
Figure 4. Average Farmgate Price Per Kilogram of Top Fish Species on Municipal Fishery Production of 1st Quarter 2020 and its Average Price Per Kilogram in 1st Quarter 2019.
Municipal fisheries data were gathered from administrative records of the Bureau of Fisheries and Aquatic Resources (BFAR), Office of the Provincial Agriculturist (PAO) thru its Fishery Coordinator and the conduct of Marine Fisheries Survey to Traditional Landing Centers.
TECHNICAL NOTES
Landing Center is a place where the fish catch and other aquatic products are unloaded and traded.
Traditional Landing Center is a type of landing center where fishermen could unload their catch and/or dock their fishing boats without any obligation or payment for the use of the place.
Quarterly Inland Fisheries Survey is a survey on volume and price of fish by species, caught by households engaged in inland fishing. It gathers quarterly data with monthly catch from sample fishing households. Respondents are fishermen or any knowledgeable member of the sample household.
Quarterly Municipal Fisheries Survey (Traditional Landing Center) – is a survey on volume and price of fish, by species, unloaded by fishing boats three (3) gross tons or less. It gathers quarterly data for the entire sample landing center with information on monthly fish unloading.
Farmgate Price - Prices received by farmers for the sale of their crops, livestock, and poultry at the location of farm. For fishery products, It is where trading occurs at the landing center.
(SGD.) AURELIA M. CANDA
Chief Statistical Specialist
| Attachment | Size |
|---|---|
|
|
2.46 MB |