

Release Date :
Reference Number :
2020-SR61-013
Population of Maria in 2015 reached 13,828
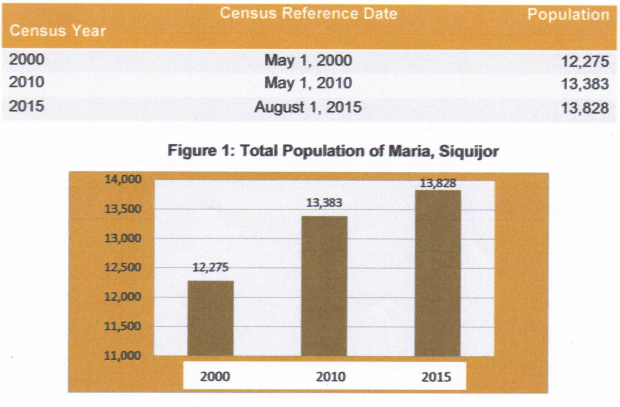
The population of the Municipality of Maria, Siquijor as of August 1, 2015 reached 13,828 based on the 2015 Census of Population (POPCEN 2015).
The 2015 population is higher by 445 compared with the population of 13,383 in 2010, and by 1,553 compared with the population of 12,275 in 2000. Refer to Table 1 and Figure 1 for data comparison by censal year.
Table 1. Total Population of Maria, Siquijor
(Based on the 2000, 2010, and 2015 Censuses)
Figure 1: Total Population of Maria, Siquijor
Annual Growth Rate (AGR) of Maria decreased in 2010-2015
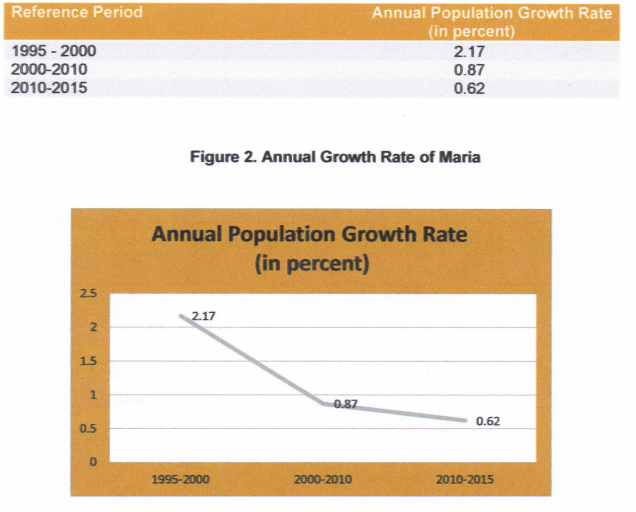
The population of Maria increased by 0.62 percent annually, on average, during the period 2010 to 2015. By comparison, the rate at which the province’s population grew during the period 2000 to 2010 was higher at 0.87 percent. Much high during years 1995 to 2000 with an annual growth rate of 2.17. This means that the annual growth rate for the past years and censuses were decreasing. See Table 2 and Figure 2 for the comparison of the annual growth rate by different censuses.
Table 2. Annual Growth Rate of Maria
(Based on the 2000, 2010, and 2015 Censuses)
Figure 2. Annual Growth Rate of Maria
Municipality of Maria is the second smallest municipality in Siquijor Province
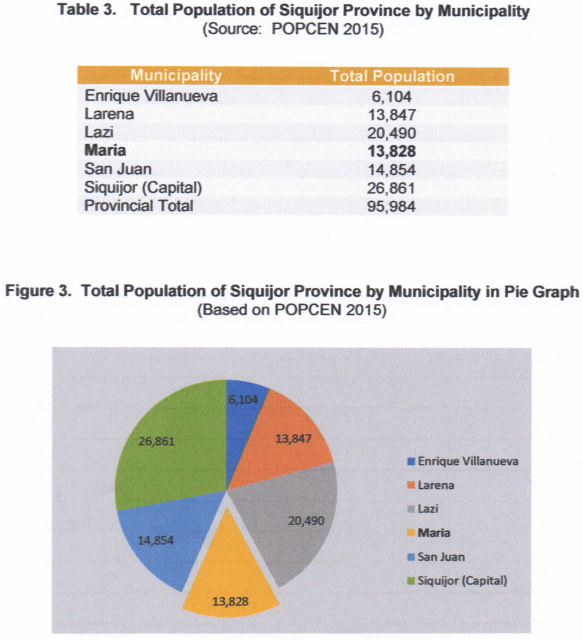
Municipality of Maria is second smallest municipality of Siquijor Province in terms of population at 13,828. It has a land area of 53.67 square kilometres. See Table 3 for the complete list of population by municipality and Figure 3 for the graph of the municipal population.
Table 3. Total Population of Siquijor Province by Municipality
(Source: POPCEN 2015)
Figure 3. Total Population of Siquijor Province by Municipality in Pie Graph
(Based on POPCEN 2015)
Only two out of twenty-two Barangays in Municipality of Maria have more than 1,000 population
Municipality of Maria is composed of 22 barangays. Only two barangays reached 1,000 population namely; Lilo-an with 1,414 and Poblacion Norte with 1,089.
The smallest barangay in terms of population is Pisong B, a mountainous barangay, with a population at 274. See Table 4 for the complete list of barangays and its population.
Table 4. Total Population of Maria by Barangay
(Source: POPCEN 2015)

Household Population comprised 99.91 percent of the total population
Municipality of Maria has a household population of 13,816 in 2015. This means that out of the total population of 13,828 there were 12 which belonged to institutional population. Thus, the household population comprised 99.91percent of the total population while the institutional population recorded at 0.09 percent.
The municipality recorded only one institutional living quarter where these 12 persons in an institution were living. Please refer to Figure 4 for the illustration of the household and institutional population.
Number of households decreased by 25 from 3,189 in 2010 down to 3,164 in 2015
The total number of households of Maria in 2015 was recorded at 3,164 which were lower by 25 households compared with 3,189 in 2010.
Least number of households is barangay Pisong B with 51, followed by Pisong A with 75. These two barangays are mountainous part of the municipality.
Barangay Poblacion Norte has the biggest number of households with 243. No barangays have reached 250 households during the 2015 census.
See Table 5 for the complete list of barangays and its corresponding number of households.
Table 5. Household Population and Number of Households of Maria, Siquijor by Barangay
(Source: POPCEN 2015)

Average household size was 4.37 persons in 2015
Average household size (AHS) in the Municipality of Maria increased from 4.20 persons in 2010 up to 4.37 persons in 2015. This means that there are 4 to 5 persons who live in a household on the average. The increase was due to the increase of population but the there was a decrease on the number of households. The AHS of 4.37 is higher than the provincial average of 4.19 in 2015.
Technical Notes
The 2015 Census of Population (POPCEN 2015) was undertaken by the Philippine Statistics Authority (PSA) in August 2015 as mandated by Republic Act No. 10625, otherwise known as the Philippine Statistics Act of 2013. It was the 14th Census of Population that was undertaken since the first census in 1903. POPCEN 2015 was designed to take an inventory of the total population all over the Philippines and collect information about their characteristics. Census day for the POPCEN 2015 was August 1, 2015 (12:01 a.m.). POPCEN 2015 made use of the de jure concept of enumeration wherein households and persons are enumerated in the area where they usually reside as of the census reference date. Enumeration lasted for about 25 days, from 10 August to 6 September 2015. Enumeration was extended until 15 September 2015 for large provinces and some highly urbanized cities.
Definition of Terms
Household is a social unit consisting of a person living alone or a group of persons who sleep in the same housing unit and have a common arrangement in the preparation and consumption of food.
Institutional Population comprises of persons who are found living in institutional living quarters.
Average household size the average number of persons who live in the household, computed as the household population in a given area divided by the corresponding total number of households in that area.
(SGD.) AURELIA M. CANDA
Chief Statistical Specialist
| Attachment | Size |
|---|---|
|
|
3.89 MB |