

Release Date :
Reference Number :
2021-SR61-016
Siquijor CPI increases at 131.2 in June
As of June 2021 the survey of retail prices of commodities conducted by Philippine Statistics Authority (PSA) in Siquijor Province has generated a CPI of 131.2 using 2012 as the base year. It is the highest CPI in second quarter of 2021 compared to 130.9 in May and 130.7 in April. CPI is an indicator of the changes in the average retail prices of a fixed basket of goods and services commonly purchased by Siquijodnons relative to the base year. Thus, the June 2021 CPI implied that the cost of a basket of goods and services commonly purchased by typical Filipino households in the Province of Siquijor was at an average of P131.2.
Table 1 below shows the CPI result of Siquijor by commodity group for the second quarter of 2021.
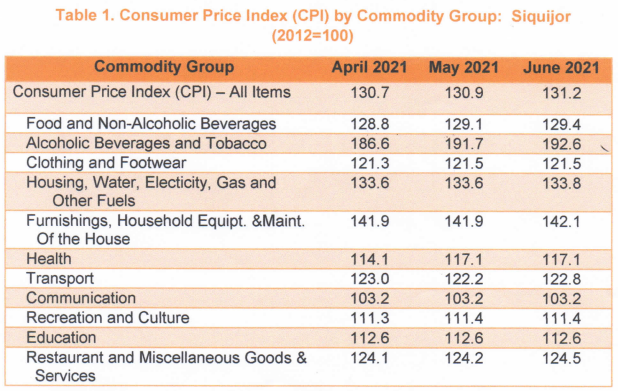
As shown in Table 1, commodities under Alcoholic Beverages and Tobacco remains with the highest CPI at 192.6 in June 2021 which is constantly increasing from 186.6 in April 2021 and 191.7 in May 2021.This is followed by the commodity group of Furnishings, Household Equipment and Maintenance of the House which recorded a CPI at 142.1 in June 2021 from the same index in April and May at 141.9. Housing, Electricity, Gas and other Fuels recorded at 133.8 in June with a slight increase from 133.6 during the months of April and May 2021. Most of the sub-groups showed a slight monthly increase from April 2021 to June 2021. Communication (103.2) and Education (112.6) remained at the same index during the second quarter of 2021. Only Transportation showed a decrease index with 123.0 in April but recorded at 122.2 in May and 122.8 in June. Figure 1 shows the graph of CPI for all items from April 2020 to June 2021.
Siquijor Province Inflation higher at 2.4% in June 2021
Siquijor inflation in June 2021 increased at 2.4% from the previous month with inflation at 2.3%. From the same period in June 2020 inflation was low at 1.9%. But the inflation at 1.7% in April 2021 decreased compared to its same month last year with inflation at 2.8%. The inflation in May 2021 increased from last year same period at 1.8%.
Inflation Rate is the rate of change of the CPI expressed in percent. See Table 2 for the year on year inflation rate for all items.
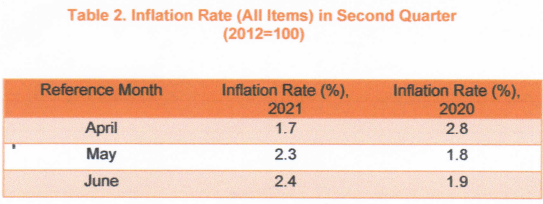
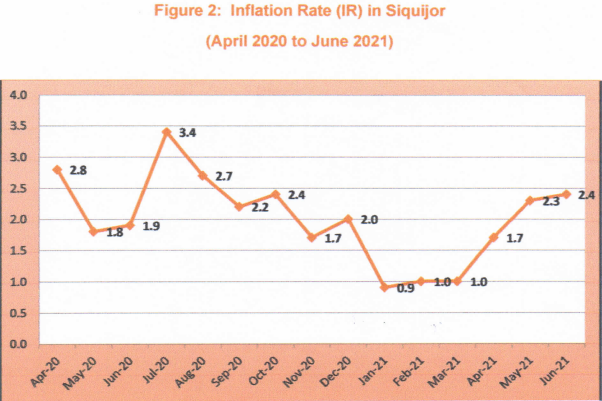
Figure 2 below shows for graph for Inflation Rate from April 2020 to June 2021.
Purchasing Power of Peso (PPP) remains at 0.77
For the past 2 months, May 2021 and June 2021, the purchasing power of peso in Siquijor Province remains at 0.76. It has a difference of 1 centavo from April 2021 with a PPP of 77 centavos. From the same quarter last year the PPP remained at 0.78 from April to June 2020.
With the value of Php 1.0 in 2012, as the base year, PPP values only at Php 0.77 in April 2021 and at 0.76 in May and June 2021.
See Table 3 for the second quarter of 2021 PPP.
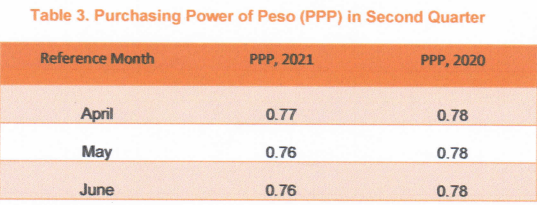
Figure 2 below shows the declining graph of purchasing power of peso from April 2020 to June 2021.
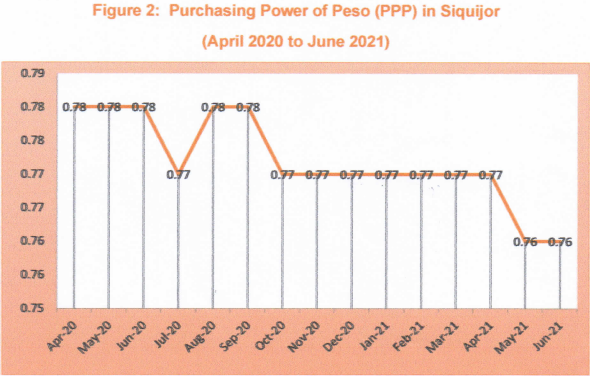
Purchasing Power of Peso (PPP) is computed as the reciprocal of the CPI multiplied by 100. The PPP is inversely related to inflation rate. Thus, as the inflation rate increases, PPP declines.
(SGD.) AURELIA M. CANDA
Chief Statistical Specialist
| Attachment | Size |
|---|---|
|
|
2.73 MB |