

Release Date :
Reference Number :
2019-SR61-010
OTHER CROPS SITUATIONER 2017
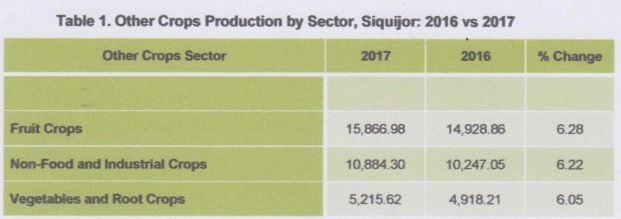
The total production of other crops in the province of Siquijor was estimated at 31,966.90 metric tons in 2017. Fruits sector shared the biggest contribution of 15,866.98 metric tons. It was followed by Non-Food and Industrial Crops sector with a production share of 10,884.30 metric tons and Vegetables and Root Crops sector with 5,215.62 metric tons production share
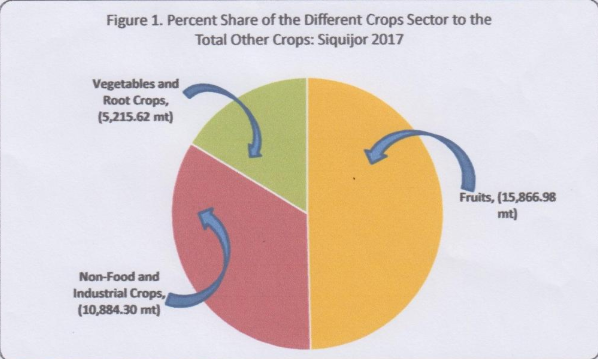
It inclined by 6.22 percent compared to its record in 2016 at only 30,094.12 metric tons. Fruits, Vegetables and Root Crops and Non-Food and Industrial crops sectors all contributed to the production gain bearing the increases of 6.28 percent, 6.05 percent and 6.22 percent, respectively.
FRUITS PRODUCTION MOVES UP IN 2017
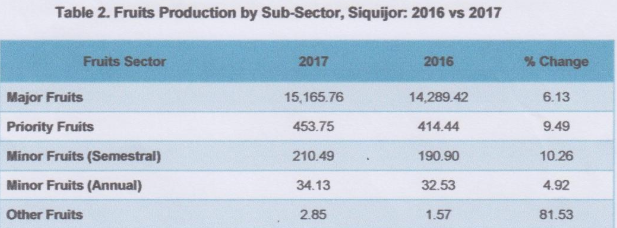
Fruits production in the province of Siquijor reached to a total of 15,866.98 metric tons in 2017 higher by 6.28 percent compared with its production in 2016 at 14,928.86 metric tons. The positive growth was attributed to the increase in production of major fruits by 6.13 percent (from 14,289.42 metric tons to 15,165.76 metric tons) and priority fruits by 9.49 percent (from 414.44 metric tons to 453.75 metric tons) increase.
NON-FOOD AND INDUSTRIAL CROPS INCLINES IN 2017
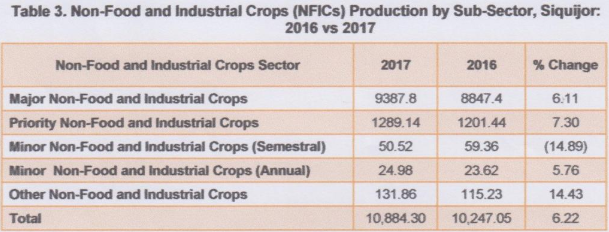
Non-Food and Industrial Crops (NFICs) was up by 6.11 percent in 2017 over last year. Its production was recorded at 10,884.30 metric tons and surpassed last year’s record of 10,247.05 metric tons. Major NFICs registered the biggest production increment of 6.11 percent. In 2016, its production was recorded at 8,847.40 metric tons and it increased to 9,387.80 metric tons in 2017. Priority NFICs also increased 1.201.44 metric tons in 2016 to 1,289.14 metric tons in 2017. Minor NFICs (Annual) and Other NFICs also showed positive trends of 5.76 percent and 14.43 percent increases, respectively. On the other hand, Minor NFICs (Semestral) decreased from 59.36 metric tons in 2016 to 50.52 metric tons in 2017.
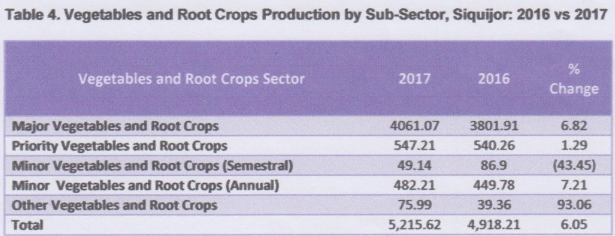
VEGETABLES AND ROOT CROPS INCREASES BY 6.82 PERCENT IN 2017
Production on Vegetables and Root Crops in Siquijor marked at 5,215.62 metric tons in 2017. It was 6.82 percent higher than its record in 2016 of 4,918.21 metric tons. The production increment was contributed by Major, Priority, Minor (Annual) and Other Vegetables. Major vegetables increased from 3,801.91 metric tons in 2016 to 4,061.07 metric tons in 2017. Priority vegetables likewise moved up from 540.26 metric tons in 2016 to 547.21 metric tons in 2017. Minor vegetables (annual) and other vegetables also showed upward trends of 7.21 percent and 93.06 percent in 2017. However, Minor vegetables (semestral) decreased from 86.90 metric tons in 2016 to 49.14 metric tons in 2017.
TECHNICAL NOTES ON CONCEPTS AND DEFINITIONS
Crop Production is the quantity produced and actually harvested for a particular crop during the reference period. It includes those harvested but damaged, stolen, given away, consumed, given as harvesters' and threshers' shares, reserved etc. Excluded are those produced but not harvested due to low price, lack of demand and force majeure or fortuitous events, etc.
Industrial Crops are crops that are used as inputs to other industries.
Major Crops refers to the top 19 crops in the Philippines, other than palay and corn which collectively account for more than 60 percent of the total volume of crop production. These include coconut, sugarcane, banana, pineapple, coffee, mango, tobacco, abaca, peanut, mongo, cassava, sweet potato, tomato, garlic, onion, cabbage, eggplant, calamansi and rubber
Minor Crops are all the remaining crops other than the major crops. This group accounts for about 40 percent of the total crop production. Non-Food Crops are crops other than those used for food consumption. These are crops grown for their aesthetic values such as ornamental plants and cut-flowers. These also include agriculture-derived products such as rice hay and coconut leaves.
Priority Crops is the identified national banner crops and various regional priority crops of the then Key Commercial Crops Development Program (KCCDP), now High Value Crops Development Program (HVCDP) and crops under the Key Commodity Road Maps of the Department of Agriculture, which are being developed because of their industrial and commercial potentials.
Approved by:
(SGD) AURELIA M. CANDA
Chief Statistical Specialist
| Attachment | Size |
|---|---|
|
|
1.05 MB |