

Release Date :
Reference Number :
2022-SR61-024
Siquijor Province inflation decreases by 0.7 percent in August 2022
Table A. Year-on-Year Inflation Rates, All Items, In Percent (2018=100)
1. Philippines
Philippines’ inflation rate decreased in August 2022 at 6.3 percent after five consecutive months of continuous increase. This is 0.1 percent lower in July 2022 at 6.4 percent. The Philippines’ average inflation from January to August 2022 stood at 4.9 percent. Inflation rate of the country was lower at 4.4 percent in August 2021. (Table A)
The decrease in inflation at the national level in August 2022 was mainly due to the lower annual increment posted in the index for transport compared to the previous month. Decrease of indices were also recorded in these following commodity groups: food and non-alcoholic beverages and information and communication. (Press Release for Summary Inflation Report of Consumer Price Index (2018=100): August 2022)
2. Central Visayas
In August 2022, the inflation rate in Central Visayas continued to increase at 7.4 percent. Central Visayas recorded an increase of 0.5 percent with a monthly percent change of 0.4 percent from July 2022 inflation at 6.9 percent. The first seven months of the year posted an average inflation of 5.7 percent. In August 2021, inflation rate was lower at 1.9 percent. (Table A)

3. Province of Siquijor
Inflation rate of the Province of Siquijor showed a decline in August 2022 at 8.6 percent after six consecutive months of acceleration. This is 0.7 percent lower in July 2022 with an inflation rate of 9.3 percent. With this month’s inflation, the province recorded an average inflation of 6.6 percent from January to August 2022. In August 2021, inflation of the province was lower at 3.1 percent. (Table A & B and Figure 1)
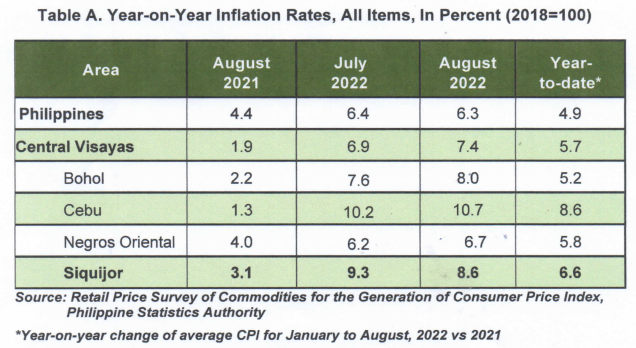
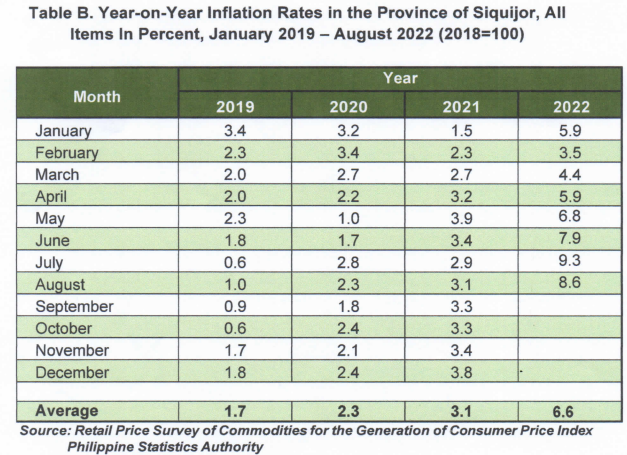
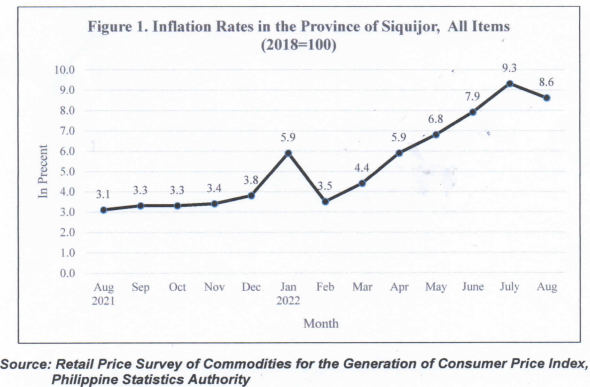
Table B. Year-on-Year Inflation Rates in the Province of Siquijor, All Items In Percent, January 2019 – August 2022 (2018=100)

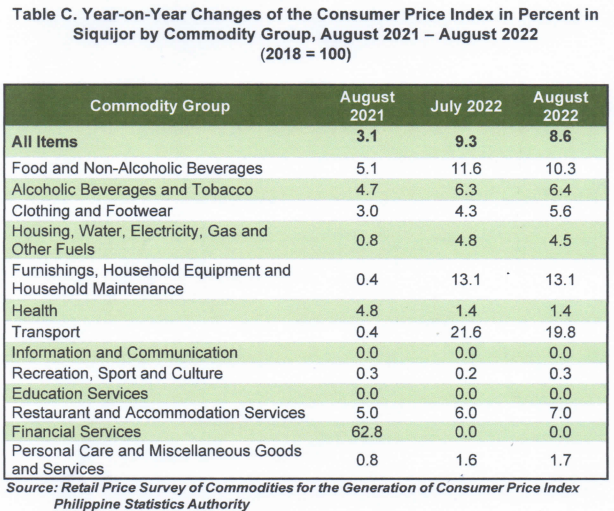
The decline of inflation in the province in August 2022 was primarily due to the lower recorded index in food and non-alcoholic beverages at 10.3 percent from the previous month’s record of 11.6 percent. Also, decreased in the following indices contributed to the slowdown of inflation in the province: transport at 19.8 percent from the last month’s record of 21.6 percent and housing, water, electricity, gas and other fuels at 4.5 percent from the last month’s record of 4.8 percent.
On the other hand, increase of indices of the following commodity groups were observed for this month’s inflation:
Alcoholic Beverages and Tobacco;
Clothing and Footwear;
Recreation, Sport and Culture;
Restaurants and Accommodation Services; and
Personal Care, and Miscellaneous Goods and Services.
Moreover, the following commodity groups retained its previous month’s inflation rate:
Furnishings, Household Equipment and Routine Household Maintenance;
Health;
Information and Communication;
Education Services; and
Financial Services.
Table C. Year-on-Year Changes of the Consumer Price Index in Percent in Siquijor by Commodity Group, August 2021 – August 2022
(2018 = 100)
Consumer Price Index and Purchasing Power of Peso (PPP)
The month of August for the year 2022 generated a CPI of 116.6. This means that the same basket of goods and services worth 100 pesos in year 2018 is worth 116.6 pesos in August 2022. This is lower 0.6 from the previous month’s record of 117.2.
August 2022 also generated a Purchasing Power of Peso (PPP) of 0.86. This translates that a peso in 2018 is only worth 0.86 in August 2022 and this is lower by 0.1 from July 2022 record of 0.85.
TECHNICAL NOTES
Uses of CPI
The CPI is most widely used in the calculation of the inflation rate and purchasing power of peso. It is a major statistical series used for economic analysis and as monitoring indicator of the government economic policy.
Measures the composite change in the consumer prices in various commodities overtime.
Computation of CPI
The computation of CPI involves consideration of the following important points:
Base Period – The reference date or base period is the benchmark or reference date or period at which the index is taken as equal to 100.
Market Basket – A sample of the thousands of varieties of goods purchased for consumption and the services availed by the households in the country selected to represent the composite price behavior of all goods and services purchased by consumers.
Weighting System – The weighting pattern uses the expenditures on various consumer items purchased by households as a proportion to total expenditure.
Formula – The formula used in computing the CPI is the weighted arithmetic mean of price relatives, the Laspeyre’s formula with a fixed base year period (2018) weights.
Geographic Coverage – CPI values are computed at the national, regional, and provincial levels, and or selected cities.
Inflation Rate is the rate of change of the CPI expressed in percent. See table C for the year on year inflation rate for all items.
(SGD) AURELIA M. CANDA
Chief Statistical Specialist
| Attachment | Size |
|---|---|
|
|
2.91 MB |