

Release Date :
Reference Number :
2021-SR61-015
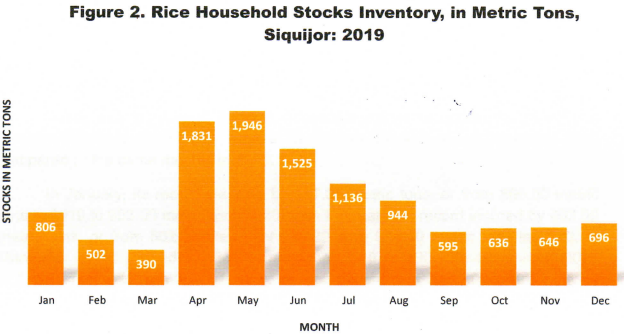
RICE HOUSEHOLD STOCKS INVENTORY, 2019
May of 2019 recorded the highest inventory of rice household stocks with a total of 1, 946 metric tons. The month of April, with 1, 831 metric tons, and June, with 1, 525 metric tons, respectively followed the record set in the month of May. The lowest inventory of rice rice household stocks was reported in March with a mark of 390 metric tons.
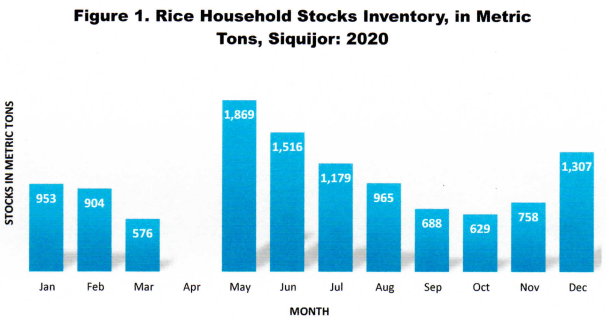
RICE HOUSEHOLD STOCKS INVENTORY, 2020
In 2020, the month of May still recorded the highest inventory of rice household stocks which registered a total of 1, 869 metric tons. It was followed by the months of June and December at 1, 516 metric tons and 1, 307 metric tons, respectively. March of 2020 had the lowest inventory of rice household stocks at 576 metric tons. No survey conducted for the month of April 2020 due to Covid – 19 pandemic.
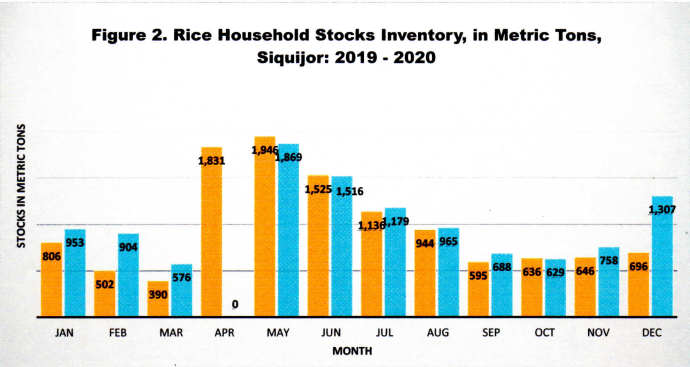
RICE HOUSEHOLD STOCKS INVENTORY, 2019 - 2020
There was an upward trend in household stocks of rice in the months of January, February, March, July, August, September, November and December 2020 compared to the same months in 2019.
In January, its record went up by 147.00 metric tons, or from 806.00 metric tons in 2019 to 953.00 metric tons in 2020. In February, its record inclined by 402.00 metric tons, or from 502.00 metric tons in 2019 to 904.00 metric tons in 2020. In March, its record jumped by 186.00 metric tons, or from 390.00 metric tons in 2019 to 576.00 metric tons in 2020. In July, its record increased by 43.00 metric tons, or from 1, 136.00 metric tons in 2019 to 1, 179.00 metric tons in 2020. In August, its record grew by 21.00 metric tons, or from 944.00 metric tons in 2019 to 965.00 metric tons in 2020. In September, its record rose by 93.00 metric tons, or from 595.00 metric tons in 2019 to 688.00 metric tons in 2020. For the months of November and December, its record surpassed by 112.00 and 611.00 metric tons, or from 646.00 metric tons in 2019 to 758.00 metric tons in 2020 and from 696.00 metric tons in 2019 to 1, 307.00 metric tons in 2020, respectively.
However, there was a downward trend in the months of May, June, and October 2020 compared to its records in 2019. No data was reported in April of 2020 due to Covid – 19 pandemic.
TECHNICAL NOTES
The rice stocks inventory is generated from three sectors, namely: household, commercial, and government stocks (National Food Authority). The household stocks are taken from the Palay and Corn Stocks Survey (PCSS) of the PSA, which covers farming and non-farming households nationwide. The commercial stocks are sourced from registered grains businessmen through the Commercial Stocks Survey (CSS), conducted by the NFA. The government stocks are monitored from NFA warehouses/depositories. The PSA consolidates the stocks inventories from the three sectors which is disseminated monthly through a special release on Rice and Corn Stocks Inventory.
The availability of information on current supply of rice and corn is an essential factor in the formulation of agricultural economic programs and policies on food security. The information is even more relevant due to the frequent occurrence of typhoons and other natural calamities in the country. This prompts the need to monitor stocks situation of the food staples to ensure supply and demand equilibrium, access, and price stability. Thus, the conduct of the stock surveys for palay and corn.
The objective of the survey is to generate estimates on current stock of rice and corn in farming and non-farming households.
The data generated from the survey serve as input in the:
analysis of the seasonal trends and variations in the supply of rice and corn;
forecasting future supply and demand of palay and corn; and
determination of quantity to be imported by government planners for food security purposes.
The information being collected is used to monitor stocks situation of the food staples to ensure supply and demand equilibrium, access, and price stability. Information on stocks holdings can guide policy makers when and how much to import rice especially in time of emergency. It also serves as inputs to the estimation and compilation of national accounts. Moreover, the survey supports the data needs of planners, policy and decision makers, and other stakeholders in the agriculture sector particularly the National Economic and Development Authority (NEDA), National Food Authority (NFA), Department of Agriculture (DA) and its attached agencies such as Philippine Rice Research Institute (PhilRice), Philippine Council for Agriculture and Fisheries (PCAF), and the general public.
(SGD.) AURELIA M. CANDA
Chief Statistical Specialist
| Attachment | Size |
|---|---|
|
|
2.48 MB |