Bohol
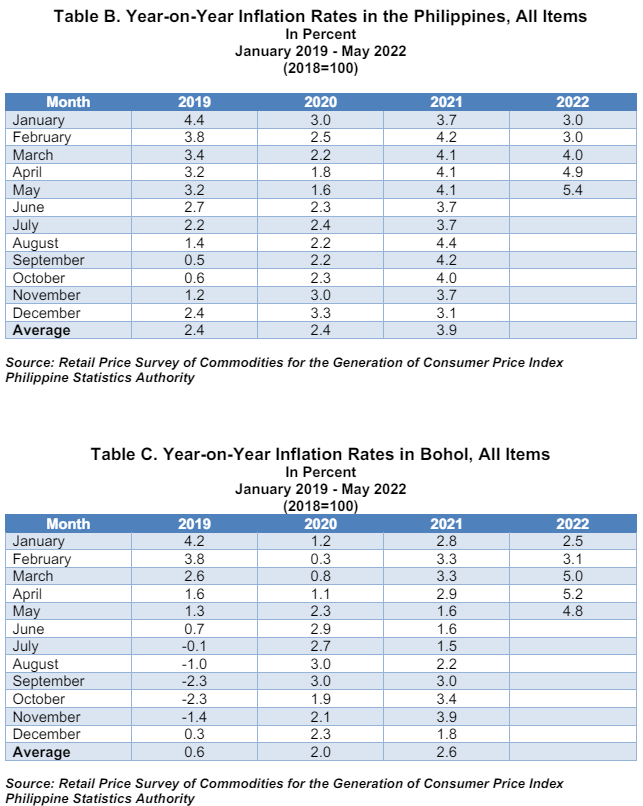
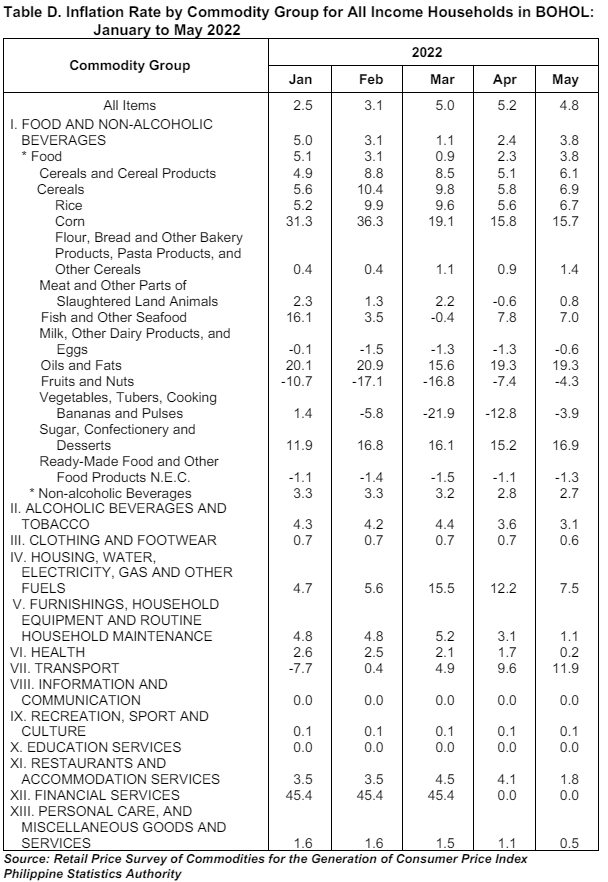
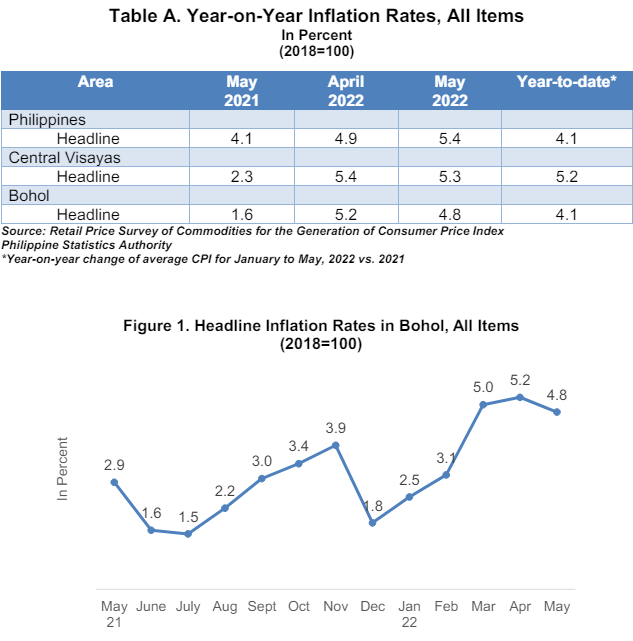
The headline inflation in Bohol decreased to 4.8 percent in May 2022, from 5.2 percent in April 2022. Inflation in May 2021 was lower by 3.2 percentage points at 1.6 percent. The average inflation for the first five months of the year stood at 4.1 percent. (Table A and Figure 1)
In comparison to national and regional figures, Bohol’s inflation rate (IR) in May is lower by 0.6 percentage points than the national IR and by 0.5 than the regional IR.
The increase in the province’s inflation was mainly brought about by the higher annual increase in the index for Food and Non-alcoholic Beverages at 3.8 percent; Housing, Water, Electricity, Gas, and Other Fuels, 7.5 percent; and Transport, 11.9 percent. (Table D) Also contributing to the uptrend in the overall inflation during the period were the high annual increments in the indices of the following commodities:
a. Alcoholic beverages and tobacco, 3.1 percent;
b. Restaurants and Accommodation Services, 1.8 percent; and
c. Furnishings, Household Equipment and Routine Household Maintenance, 1.1.
Meanwhile, as compared with their previous month’s inflation rates, annual upticks slowed down in most of the major commodity groups.
The commodity groups Information and Communication; Recreation, Sport and Culture; Education Services; and Financial Services either retained their previous month’s inflation rates or had zero percent annual growths.
For food index, it increased further by 3.8 percent in May 2022, from 2.3 percent in the previous month. In May 2021, food index had a negative inflation rate at -0.1 percent.
Double-digit growth rates were observed in Corn at 15.7 percent; oils and fats index at 19.3 percent; and sugar, confectionery and desserts at 16.9 percent. The following food groups had higher annual increments during the month in comparison with the previous month:
a. Cereals and Cereal Products, 6.1 percent;
b. Cereals, 6.9 percent;
c. Meat and Other Parts of Slaughtered Land Animals, 0.8 percent;
d. Milk, Other Dairy Products, and Eggs at -0.6;
e. Fruits and Nuts, -4.3;
f. Vegetables, Tubers, Cooking Bananas and Pulses, -3.9; and
g. Sugar, Confectionery and Desserts, 16.9 percent.
On the other hand, Fish and Other Seafood, and Ready-Made Food and Other Food Products N.E.C. had lower annual growths during the month. In addition, the rice index inflation moved up again to 6.7 percent in May.
