

Release Date :
Reference Number :
2020-SR61-016
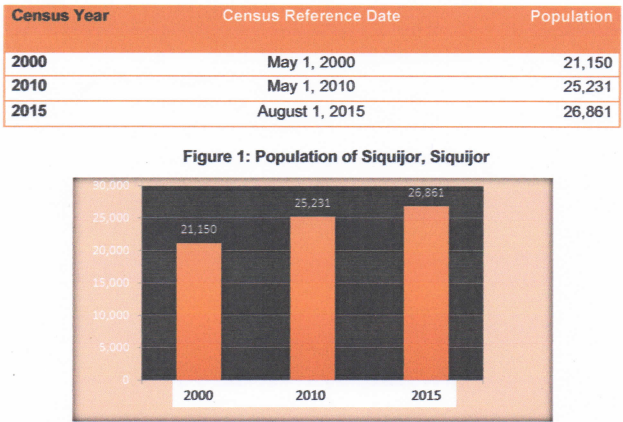
Population of Siquijor in 2015 reached 26,861
The population of the Municipality of Siquijor, Siquijor as of August 1, 2015 reached 26,861 based on the 2015 Census of Population (POPCEN 2015).
The 2015 population is higher by 1,630 compared with the population of 25,231 in 2010, and by 5,711 compared with the population of 21,150 in 2000. Refer to Table 1 and Figure 1 for data comparison by censal year.
Table 1. Population of Siquijor (Capital)
(Based on the 2000, 2010, and 2015 Censuses)
Figure 1: Population of Siquijor, Siquijor
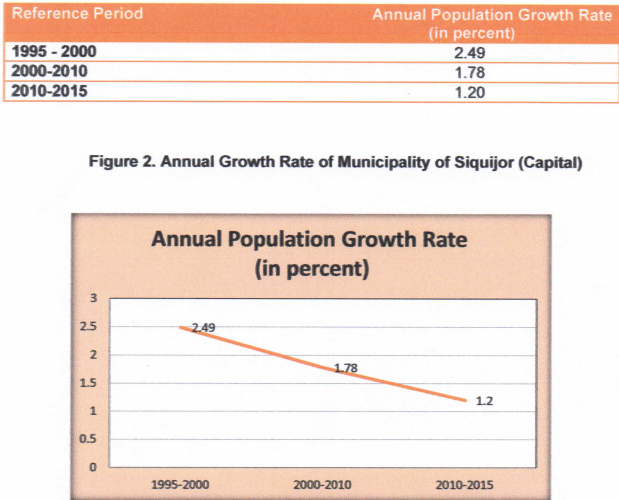
Annual Growth Rate (AGR) of Siquijor decreased in 2010-2015
The population of Siquijor increased by 1.20 percent annually, on average, during the period 2010 to 2015. By comparison, the rate at which the province’s population grew during the period 2000 to 2010 was higher at 1.78 percent. Much high during years 1995 to 2000 with an annual growth rate of 2.49. This means that the annual growth rate for the past years and censuses were decreasing. See Table 2 and Figure 2 for the comparison of the annual growth rate by different censuses.
Table 2. Annual Growth Rate of Siquijor (Capital)
(Based on the 2000, 2010, and 2015 Censuses)
Figure 2. Annual Growth Rate of Municipality of Siquijor (Capital)
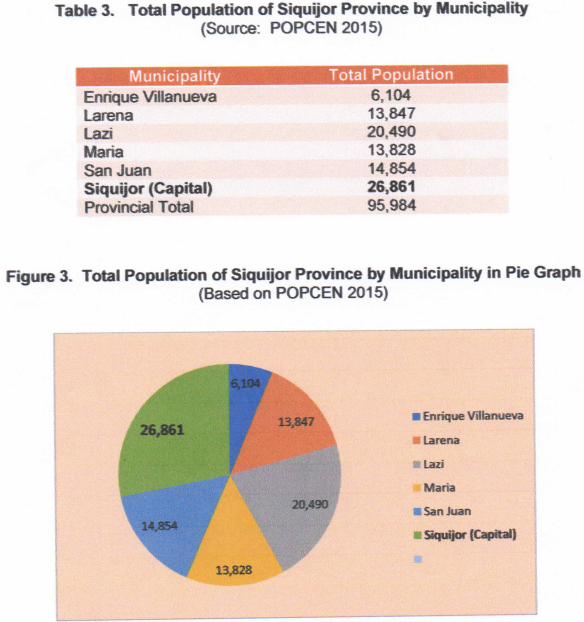
Municipality of Siquijor is the biggest municipality in Siquijor Province
Municipality of Siquijor is biggest municipality of Siquijor Province in terms of land area and population. It has a land area of 86.20 square kilometers and with total population of 26,861 in 2015. See Table 3 for the complete list of population by municipality and Figure 3 for the graph of the municipal population.
Table 3. Total Population of Siquijor Province by Municipality
(Source: POPCEN 2015)
Figure 3. Total Population of Siquijor Province by Municipality in Pie Graph
(Based on POPCEN 2015)
Only 5 out of 42 barangays have more than 1,000 populations
Municipality of Siquijor is composed of 42 barangays but only five barangays reached 1,000 population, namely: Poblacion (1,673), Pangi (1,594), Caipilan (1,126), Pasihagon (1,088) and Tinago (1,025).
The five smallest barangays by population counts are Cang-isad (171), Cangmatnog (189), Cang-inte (211), Tebjong (212) and Cangmohao (225).
See Table 4 for the complete list of barangays and its population.
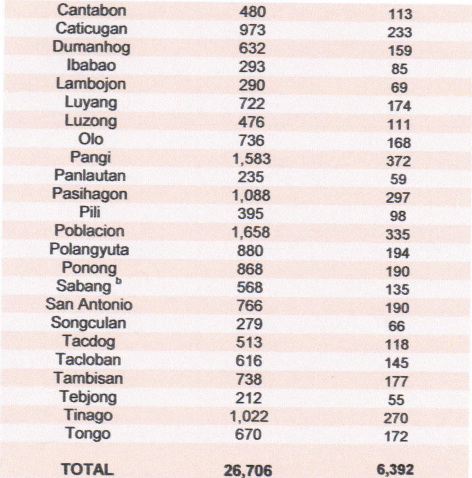
Table 4. Population of Municipality of Siquijor (Capital) by Barangay
(Source: POPCEN 2015)


Household Population comprised 99.42 percent of the total population
Municipality of Siquijor has a household population of 26,706 in 2015. This means that out of the total population of 26,861 there were 155 persons enumerated as institutional population. Thus, the household population comprised 99.42 percent of the total population while the institutional population recorded at 0.58 percent.
The municipality also recorded a total of 9 institutional living quarters where these 155 persons were living. Please refer to Figure 1 for the illustration of the household and institutional population.
The total number of households of Municipality of Siquijor in 2015 was recorded at 6,392 higher by 695households compared with 5,697 in 2010. It increased by 12.20 percent from 2010 to 2015.
No barangay had reached 400 households in 2015
In 2015 no barangay in Municipality of Siquijor had reached 400 households.
Barangay Pangi has the highest number of households with 372. It was followed by Poblacion (335), Pasihagon (297), Tinago (270) and Candanay Sur (249).
Least number of households are barangays Cang-inte (40), Cang-isad (46), Cangmatnog (47), Tebjong (55) and Bolos (56).
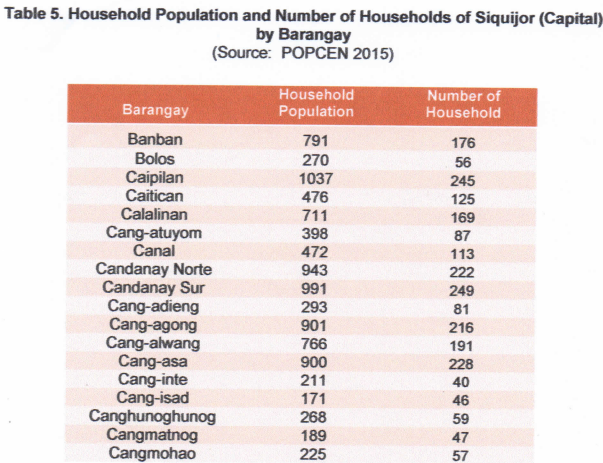
See Table 5 for the complete list of barangays and its corresponding number of households.
Table 5. Household Population and Number of Households of Siquijor (Capital) by Barangay
(Source: POPCEN 2015)
Average household size was 4.18 persons in 2015
Average household size (AHS) in the Municipality of Siquijor decreased from 4.40 persons in 2010 to 4.18 persons in 2015. This means that there are 4 to 5 persons who live in a household on the average. The AHS of 4.18 is lower than the provincial average of 4.19 in 2015.
Technical Notes
The 2015 Census of Population (POPCEN 2015) was undertaken by the Philippine Statistics Authority (PSA) in August 2015 as mandated by Republic Act No. 10625, otherwise known as the Philippine Statistics Act of 2013. It was the 14th Census of Population that was undertaken since the first census in 1903. POPCEN 2015 was designed to take an inventory of the total population all over the Philippines and collect information about their characteristics. Census day for the POPCEN 2015 was August 1, 2015 (12:01 a.m.). POPCEN 2015 made use of the de jure concept of enumeration wherein households and persons are enumerated in the area where they usually reside as of the census reference date. Enumeration lasted for about 25 days, from 10 August to 6 September 2015. Enumeration was extended until 15 September 2015 for large provinces and some highly urbanized cities.
Definition of Terms
Household is a social unit consisting of a person living alone or a group of persons who sleep in the same housing unit and have a common arrangement in the preparation and consumption of food.
Institutional Population comprises of persons who are found living in institutional living quarters.
Average household size the average number of persons who live in the household, computed as the household population in a given area divided by the corresponding total number of households in that area.
(SGD.) AURELIA M. CANDA
Chief Statistical Specialist
| Attachment | Size |
|---|---|
|
|
4.78 MB |