

Release Date :
Reference Number :
2019-SR61-015
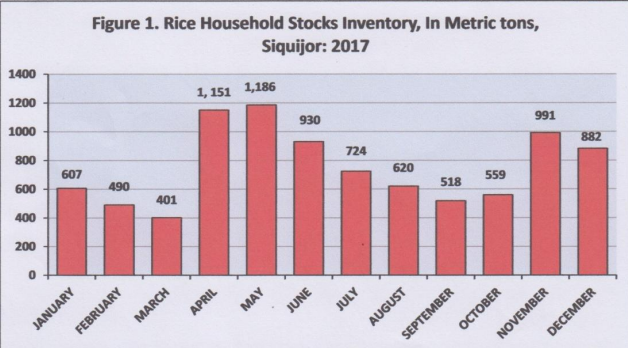
RICE HOUSEHOLD STOCKS INVENTORY, 2017
The lowest inventory of rice household stocks in 2017 was reported in March with a record of 401.00 metric tons. The highest inventory however was reported in May with a record of 1, 186.00 metric tons (see figure 1).
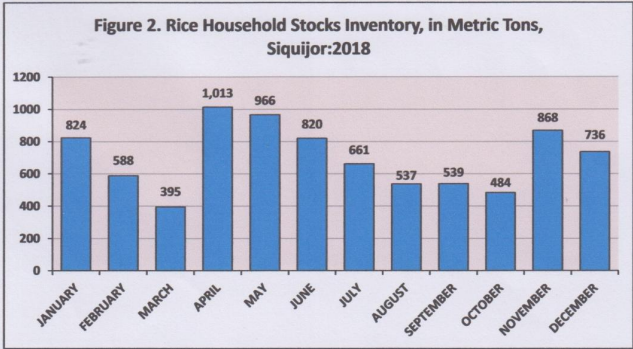
RICE HOUSEHOLD STOCKS INVENTORY, 2018
Inventory of rice household stocks in April was the highest in 2018. Its record was registered at 1,013 metric tons. It was followed with 966.00 metric tons in May and 868.00 metric tons in November. The lowest stocks inventory was reported in March with only 395.00 metric tons. (see figure 2).
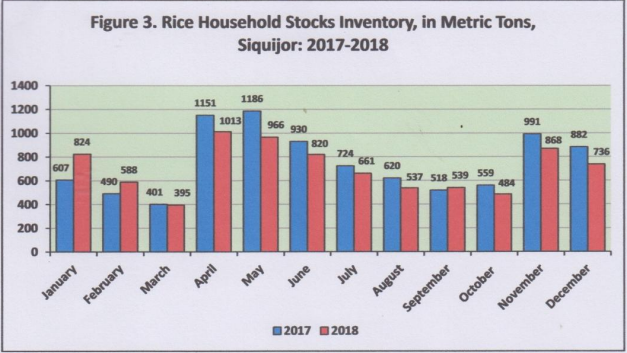
The trend in household stocks of rice in the province was positive in January, February and September 2018 compared to the same months in 2017. In January, its record was up by 217.00 metric tons, or from 607.00 metric tons in 2017 to 824.00 metric tons in 2018. In February and September, it went up from 490.00 metric tons in 2017 to 588.00 metric tons in 2018 and from 518.00 metric tons in 2017 to 539.00 metric tons in 2018, respectively.
However, the trend was negative in March, April, May, June, July, August, October, November and December 2018 compared to its records in 2017 (see figure 3).
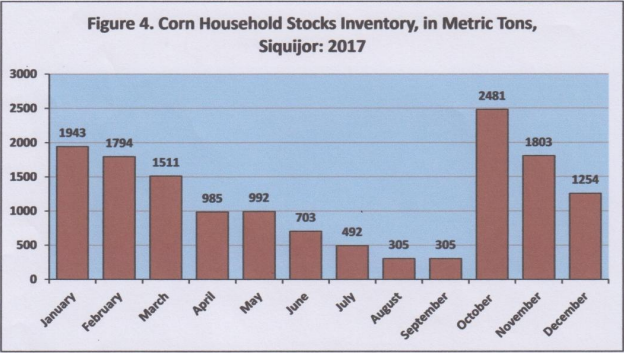
CORN HOUSEHOLD STOCKS INVENTORY, 2017
Corn household stocks in October were the highest inventory in 2017. Its record was 2,481.00 metric tons. However, the lowest inventory was reported in August and September having the same record of 305.00 metric tons (see figure 4).
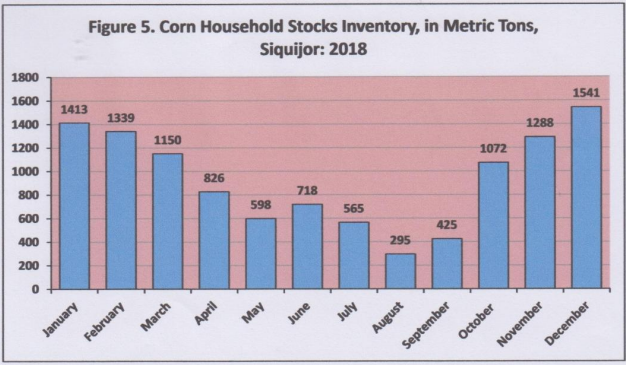
CORN HOUSEHOLD STOCKS INVENTORY, 2018
Inventory of corn household stocks in August 2018 was only 295.00 metric tons. This month was the lowest of the year. In December, its inventory was 1,541.00 metric tons, which was the highest inventory of the year (see figure 5).
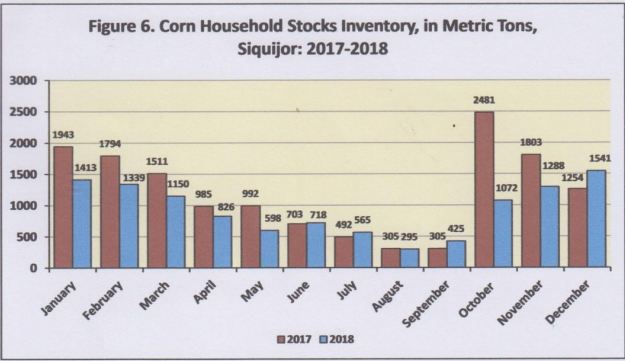
CORN HOUSEHOLD STOCKS INVENTORY, 2017-2018
Corn household stocks in the province increased in June, July, September and December 2018 compared to the same months in 2017. The stock inventory in June 2017 was only 703.00 metric tons and it increased to 718.00 metric tons in 2018. On the same ways, the stocks inventory in July increased from 492.00 metric tons in 2017 to 565.00 metric tons in 2018, in September, from 305.00 metric tons in 2017 to 425.00 metric tons in 2018 and in December from 1,254.00 metric tons in 2017 to 1,541.00 metric tons.
On the other hand, the corn household stocks inventory went down in the remaining months in 2018 compared to 2017. The month with the biggest decrement was noted in October with stocks decrease from 2,481.00 metric tons in 2017 to only 1,072.00 metric tons in 2018 (see figure 6).
TECHNICAL NOTES
The rice and corn stocks inventory are generated from three sectors, namely: household, commercial, and government stocks (National Food Authority). The household stocks are taken from the Palay and Corn Stocks Survey (PCSS) of the PSA, which covers farming and non-farming households nationwide. The commercial stocks are sourced from registered grains businessmen through the Commercial Stocks Survey (CSS), conducted by the NFA. The government stocks are monitored from NFA warehouses/depositories. The PSA consolidates the stocks inventories from the three sectors which is disseminated monthly through a special release on Rice and Corn Stocks Inventory.
The availability of information on current supply of rice and corn is an essential factor in the formulation of agricultural economic programs and policies on food security. The information is even more relevant due to the frequent occurrence of typhoons and other natural calamities in the country. This prompts the need to monitor stocks situation of the food staples to ensure supply and demand equilibrium, access, and price stability. Thus, the conduct of the stock surveys for palay and corn.
The objective of the survey is to generate estimates on current stock of rice and corn in farming and non-farming households.
The data generated from the survey serve as input in the:
v analysis of the seasonal trends and variations in the supply of rice and corn;
v forecasting future supply and demand of palay and corn; and
v determination of quantity to be imported by government planners for food security purposes.
The information being collected is used to monitor stocks situation of the food staples to ensure supply and demand equilibrium, access, and price stability. Information on stocks holdings can guide policy makers when and how much to import rice especially in time of emergency. It also serves as inputs to the estimation and compilation of national accounts. Moreover, the survey supports the data needs of planners, policy and decision makers, and other stakeholders in the agriculture sector particularly the National Economic and Development Authority (NEDA), National Food Authority (NFA), Department of Agriculture (DA) and its attached agencies such as Philippine Rice Research Institute (PhilRice), Philippine Council for Agriculture and Fisheries (PCAF), and the general public.
(SGD.) FELICISIMO B. VALIOS
Supervising Statistical Specialist/
Officer-in-Charge
| Attachment | Size |
|---|---|
|
|
1.63 MB |