Household Population
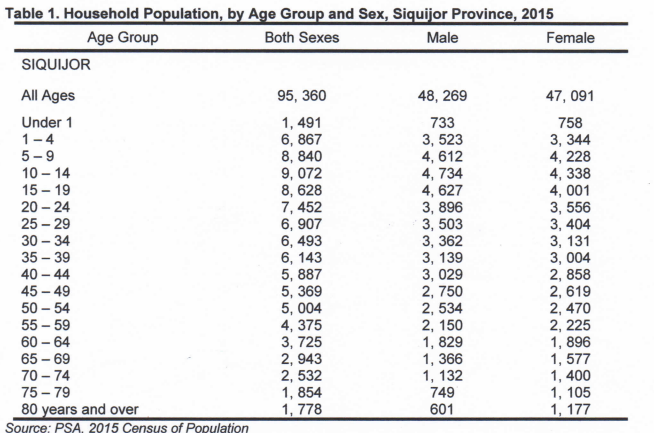
The Province of Siquijor in 2015 recorded 95,360 household population, representing 99.3 percent of the total population of 95,984. It was comprised of 48,269 or 50.62 percent men and 47,091 or 49.38 percent women.
Sex Ratio
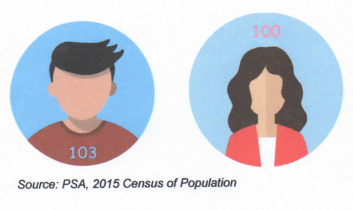
In 2015, males made up 50.8 percent of Siquijor's overall population, while females made up the remaining 49.2 percent. According to these estimates, there were 103 males for every 100 females.
Household Head
The majority of households in Siquijor was led by men. Out of the 22,737 households in the province, 17,774 or 78.1 percent were headed by men while 4,963 or 21.8 percent were headed by women.
Household Size
Male households have an average size 4.4 while female households have an average size of 3.6.
The highest percentage of households headed by males belongs to that of 4 household members while households headed by females belongs to that of 2 household members.
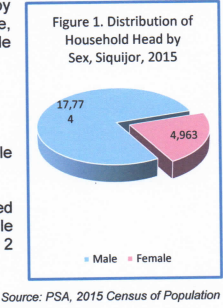
Table 1. Distribution of Households by Household Head’s Sex and Household Size, Siquijor Province, 2015

Marital Status
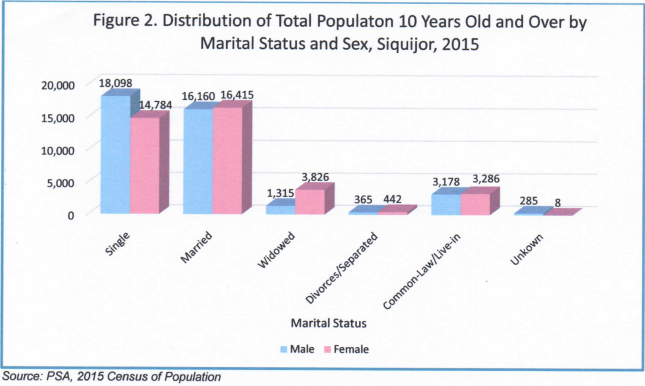
There were more females than males among the never married persons, according to the 2015 Census of Population. This means that there are more male singles than female in the province of Siquijor in 2015.
Among the total number of household population aged 10 years and over, 42 percent was never married while 41.6 was married. Among the never married persons, 55 percent was male while 44.9 percent was female. In contrast, females outnumbered males in the rest of the categories for marital status. The household population was comprised of 8.2 percent in common-law/live-in marital arrangement, 6.5 percent widowed and 1 percent divorced or separated.
Other Age Groups
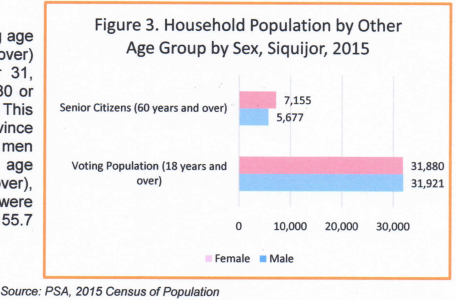
Of the 63,801 voting age (18 years old and over) population, 50 percent or 31, 192 were men while 31,880 or 49.9 percent were women. This means that Siquijor Province voting population is mostly men in 2015. For senior citizen age group (60 years and over), 5,667 or 44.1 percent were men while 7,155 or 55.7 percent were women.
Literacy Rate
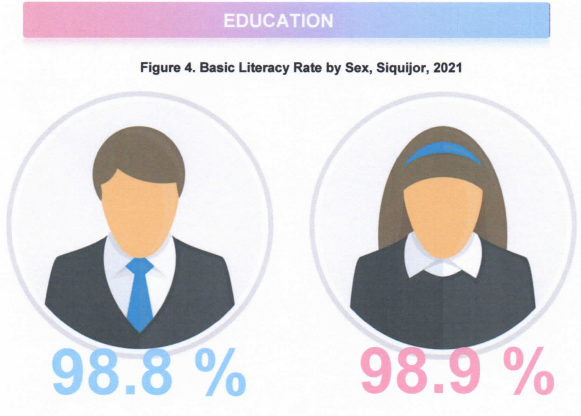
Siquijor recorded a literacy rate of 98.8 percent among 78,162 household population aged 10 years and over. This 98.8 percent literacy rate was accounted to females comprising the 38, 761 household population while males had 98.8 percent literacy rate comprising 39, 401 household population.
School Attendance/Age
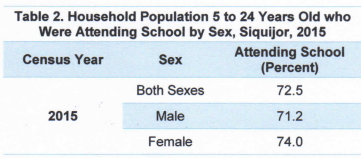
About 7 in every 10 persons aged 5 to 24 years were attending school. In School Year (SY) 2015-2016, 72.5 percent of the 33,992 household population aged 5 to 24 years attended school. In 2015, females had a higher school literacy rate of 74 percent than males which had a rate of 71.2 percent.

Highest Educational Attainment
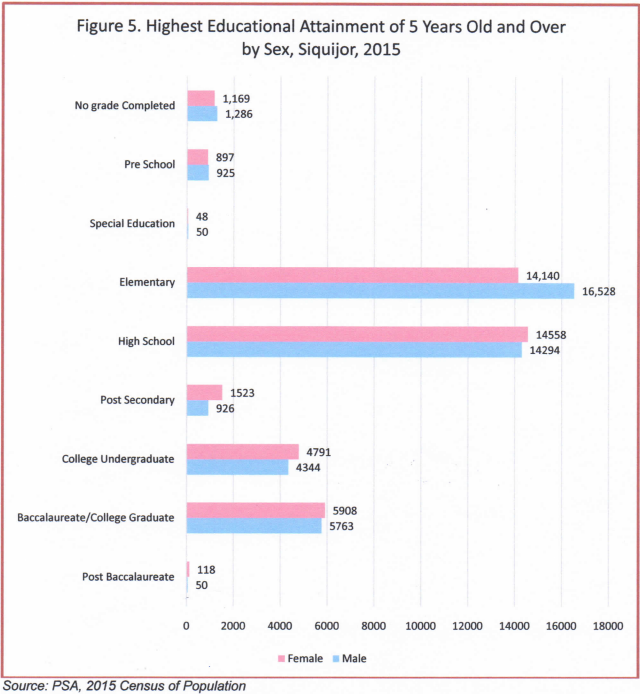
In 2015, most of the 5 years and over population was concentrated in Elementary and High School grade with mostly male in Elementary and mostly women in High School. For post-secondary, 1,523 five years and over population was accounted for female while 926 five years and over population for men.
There were also more female college undergraduates than males. Majority of academic holders were also females or 5,908 five years and over population. It was higher than males with 4,344 five years and over population. The record also shows that there were more females who have post baccalaureate degree compared to males.
Gainful Workers
About two in every three persons 15 years old and over were engaged in gainful activity
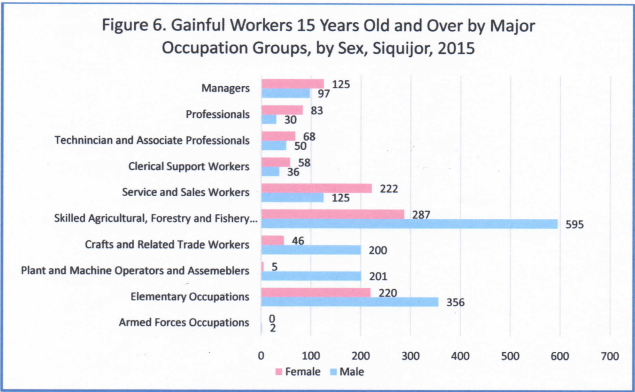
Siquijor had 69,090 household population aged 15 years and over in 2015. From this total, 63.8 percent were engaged in gainful activity during the 12 months preceding the census. Based on this, 61.2 percent were males while the remaining 38.8 percent can be accounted to females.

By major occupation, skilled agricultural, forestry, and fishery workers comprised the largest group at 32.1 percent with large number of male workers. It was followed by elementary occupation at 18 percent with mostly male workers. Service and sale workers came in next at 13.9 percent with mostly female workers. Large number of female workers was also evident in major occupation groups like managers, professionals, technician and associate professionals and clerical and support workers. Unlike major occupation such as crafts and related trade works, plant and machine operators and assemblers, and armed forces occupations which was male dominant.
Number of Registered Births
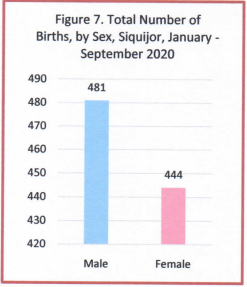
52 % of registered live births in Siquijor from January to September 2020 are male
In January to September 2020, Siquijor registered 925 live births. During this nine-month period, male is evidently dominant in terms of number of live births that constituted 52% of the total while the remaining 48% are females.
Source: Philippine Statistics Authority
Number of Deaths
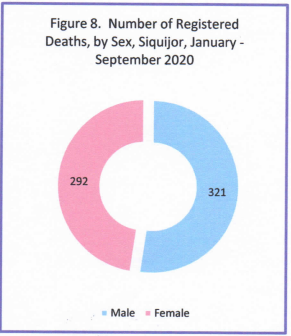
Around 47% of the Siquijor death’s toll January to September 2020 are female
Siquijor death’s toll in January to September 2020 reached 613. Of the total 613 deaths, 321 is represented by male deaths and 292 is attributed to female deaths.
By municipality, Siquijor had the highest number of deaths both male and female at 87 and 82, respectivley. On the other hand, Enrique Villanueva had the lowest number of reported deaths both male and female at 22 and 15, respectively.

City/Municipal Civil Registrars
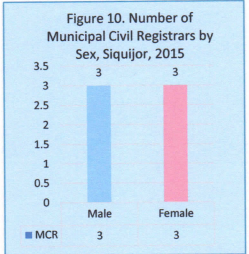
Ratio of male and female civil registrar in Siquijor is 1:1
Siquijor province municipal civil registrars had equal number of male and female. This mean that 50 percent is male and the other half is female as of May 2021.
Personnel Complement
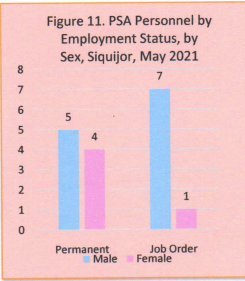
Among the current 17 Siquijor Province employees, 70 percent of it is constituted by male workers while the remaining 30 percent is female.
For permanent employees, 5 out of 9 employees are male while the remaining 4 are female. For job order workers, 87.5 percent is constituted mostly with male workers while the remaining 12.5 percent is attributed to female workers.
(SGD) AURELIA M. CANDA
Chief Statistical Specialist

