

Release Date :
Reference Number :
2023-SR61-007
MEN AND WOMEN IN SIQUIJOR
POPULATION AND DEMOGRAPHY
Household Population
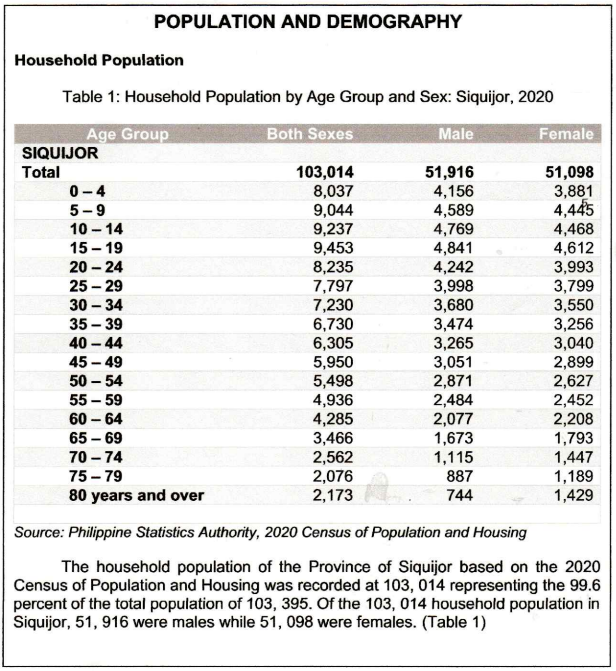
The household population of the Province of Siquijor based on the 2020 Census of Population and Housing was recorded at 103, 014 representing the 99.6 percent of the total population of 103, 395. Of the 103, 014 household population in Siquijor, 51, 916 were males while 51, 098 were females. (Table 1)
By age group, 26, 318 persons or 25.55 percent were under 15 years of age or the so-called young dependents of which 13, 514 persons were males and 12, 804 persons were females. In addition, persons aged 15 to 64 years old, or the working-age (economically active population) totaled 66, 419 persons or 64.48 percent of which 33, 983 persons were male and 32, 436 persons were female while persons aged from 65 years old and over equaled to 10, 277 persons or 9.98 percent. This age group is also known as old dependents and recorded a greater number of females at 5, 858 persons or at 57 percent than that of males at 4, 419 persons or at 46 percent. (Table 1)
In 2020, age group 15 – 19 years old had the highest number of household population for both sexes with 4, 841 males and 4, 612 females. This age group also represented 9.15 percent of the household population which was the highest in 2020 while age group 75 – 79 years old had least number of household population for both sexes with 887 males and 1, 189 females. (Table 1)
Moreover, there were more males than females in age group 0 – 54 years old in 2020. The count of males was at 42, 936 persons or 51.41 percent while number of females was at 40, 580 persons or at 48.59 percent. Meanwhile, among the older age group 55 years and over, females outnumbered the males in 2020. In this older age group, there were 13, 145 females or 52.59 percent while the number of males was at 11, 851 persons or at 47.41 percent. (Table 1)
School Age Population
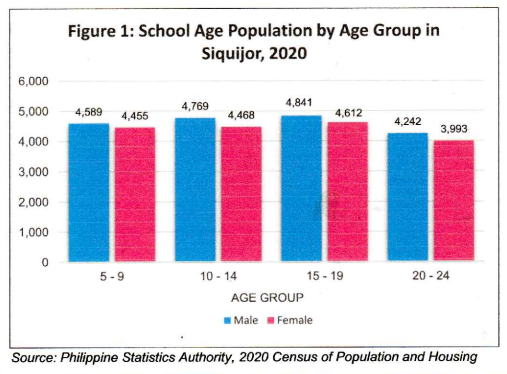
In 2020, the school age population or those persons aging from 5 to 24 years old in the Province of Siquijor was recorded at 35, 969 persons or at 34.92 percent from the total household population of 103, 014 persons. In this age group, male whose count was at 51.27 percent outnumbered the females whose count was at 48.73 percent. (Table 1)
Furthermore, age group 15 to 19 years old had the highest recorded number of persons for both sexes with 4, 841 males and 4, 612 females. Meanwhile, age group 20 to 24 years old had the lowest recorded number of persons for both sexes with 4, 242 males and 3, 993 females. (Figure 1)
Household Population by Municipality
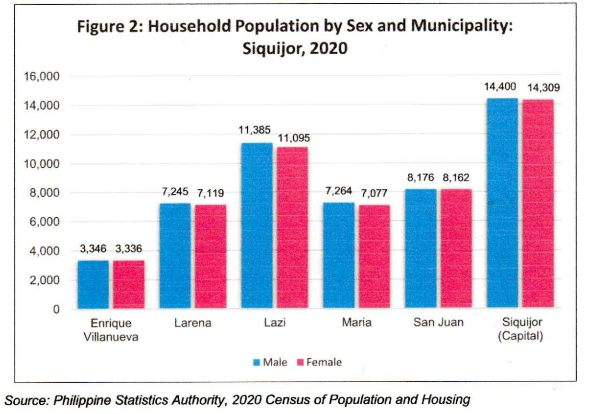
Among the six municipalities of Siquijor Province, Siquijor (Capital) had the highest number of both sexes with a total of 28, 709 persons while Enrique Villanueva had the least number of both sexes with a total of 6, 782 persons of which both municipalities had a greater number of males than females. Siquijor (Capital) had 14, 400 males and 14, 309 females while Enrique Villanueva had 3, 346 males and 3, 336 females. Additionally, a greater number of males were also recorded in the other four municipalities of Siquijor Province. (Figure 2)
Almost half of the female household population in the Province of Siquijor in 2020 were of reproductive age. Women of reproductive age or those who are in age group of 15 to 49 years old totaled to 25, 149 or 49.22 percent of the 51, 098 female household population. (Table 1)

Age group 5 to 19 years old still recorded the highest number of female populations in reproductive age at 4, 612 females or at 18.34 percent from the total number of females in reproductive age of 25, 149. On the other hand, age group 45 to 49 years old had the least accounted number of women in reproductive age at 2, 899 or at 11.53 percent.
Household Population in Enrique Villanueva
Based on the 2020 Census of Population and Housing, the household population in the Municipality of Enrique Villanueva was recorded at 6, 782 for both sexes.
Young dependents or those under 15 years old in the municipality comprised 23.34 percent of the total household population with 863 males and 720 females. The economically active population (working age) or those 15 to 64 years old was at 4, 466 persons or 65.85 percent from the total household and mostly were males at 50.85 percent while the remaining female population was at 49.15 percent.
Old dependents or those 65 years old and over in the municipality had the least number for both sexes. They were the remaining 10.81 percent from the total population of the municipality of which mostly were females at 57.44 percent while male population in this age group was at 42.56 percent.
People aged 60 years and over or those considered as senior citizens made up of 15.17 percent from the total household population in the municipality and still mostly were females at 586 persons while the remaining male population was at 443 persons. In addition, 51 percent of female population was of reproductive age or those 15 to 49 years old.
Household Population in Larena
In 2020, the Municipality of Larena registered 14, 364 persons for both sexes. Individuals aged under 15 years old or the young dependents in the municipality was composed of 22.17 percent from the total household population of which there were 1, 678 males and 1, 506 females.
Moreover, economically active population (working age) or people aged 15 to 64 years old was at 67.74 percent from the total household population in the municipality with 4, 933 males and 4, 797 females. People aged 65 years and over or the old dependents comprised the remaining 10.09 percent in the municipality. As recorded, female old dependents (56.28 percent) in this age group outnumbered the male old dependents (43.72 percent).
Those individuals who were considered senior citizen in 2020 or those 60 years old and over comprised 14.33 percent of the total household population of which female population was at 55.61 percent while male population was at 44.39 percent. Furthermore, women of reproductive age or those 15 to 49 years old in the municipality were reportedly at 53 percent or 3, 750 persons from the total household population of which mostly were in the 20 to 24 years old age group.
Household Population in Lazi
From the 2020 Census of Population and Housing, the household population of the Lazi municipality was recorded 22, 480 persons for both sexes. Young dependent or individuals aged under 15 years old totaled 6, 232 persons or 27.72 percent of the total household population of the municipality with 3, 220 males and 3, 012 females.
People aged 15 to 64 years old (working age) consisted of the 62.24 percent in the municipality from the total household population. In this economically active population, males outnumbered the females. People aged 65 years old and over comprised the remaining 10.04 percent. The number of female old dependents (55.56 percent) was greater than that of male old dependents (44.44 percent).
In addition, people considered as senior citizen or persons 60 years old and over made-up 14.11 percent of the total household population in the municipality of which mostly were females. Consequently, women in the reproductive age or females aged 15 to 49 years old of the municipality were comprised of 47 percent of the total female population of which mostly were in the 15 to 19 years age group.
Household Population in Maria
The household population of the Municipality of Maria in 2020 was posted at 14,341 persons for both sexes. Individuals aged under 5 years old constituted the 26.62 percent from the total household population of the municipality. This was translated to 3, 817 young dependents with 1, 952 males and 1, 865 females.
In addition, the working age or those individuals aged 15 to 64 years old totaled to 8, 959 persons with 4, 637 males and 4, 322 females. This economically active population was 62.47 percent of the total household population of the municipality. Meanwhile, those persons aged 65 years old and over comprised the remaining 10.91 percent of the total household population of the municipality. As posted, there were more number of females than that of males in this age group. Female old dependents was of 56.87 percent from the total number of household population in this age group while males was 43.13 percent.
Moreover, those individuals considered as senior citizen or people aged 60 years and over totaled to 2, 190 persons or 15.27 percent from the total household population of the municipality. Female senior citizen outnumbered the male senior citizen. On the other hand, women in the reproductive age was at 47 percent from the total female household population.
Household Population in San Juan
Household population in the Municipality of San Juan totaled to 16, 338 persons. This was based on the 2020 Census of Population and Housing. Young dependents in the municipality were at 25.35 percent or at 4, 141 persons of the total household population of the municipality.
Moreover, the working age or people aged 15 to 64 years old in the municipality comprised the 64.46 percent of the total household population. In this economically active population, count of males were at 5, 366 persons while females were at 5, 166 persons. Meanwhile, people aged 65 years and over represented the remaining 10.19 percent of the total household population in the municipality of which greater number of female old dependents was accounted for.
Furthermore, those individuals aged 60 years and over formed the 14.32 percent of the total household population. This can be translated to 1, 058 male senior citizen and 1, 282 female senior citizen. On the other hand, women in reproductive age made up the 49 percent from the total female household population of the municipality.
Household Population in Siquijor (Capital)
In 2020, the Municipality of Siquijor (Capital) registered 28, 709 persons for both sexes. Individuals aged under 15 years old added up to 7, 361 persons or 25.64 percent of the total population of the municipality. Male young dependents (50.46 percent) outnumbered the female young dependents (49.54 percent) in the municipality.
Further, the economically active population of the municipality was composed of 9, 614 males and 9, 127 females. This was equivalent to 65.28 percent of the total household population of the municipality. While the working age or those individuals 15 to 64 years old were mostly males in the municipality, female old dependents (58.88 percent) were greater in number than male old dependents (41.12 percent). These people aged 65 years and over constituted the 9.08 percent of the household population of the municipality.
Moreover, people aged 60 years and over made up the 13.14 percent of the total household population of the municipality. Still in this age group, greater number of female senior citizen (56.46 percent) was posted than the male senior citizen (43.54 percent). Meanwhile, fifty percent of women were of in the reproductive age from the total female household population.
(SGD.) JOSELITO C. MAGHANOY
(Supervising Statistical Specialist)
Officer-in-Charge
| Attachment | Size |
|---|---|
|
|
2.91 MB |