Starting February 2022, the Philippine Statistics Authority (PSA) released the rebased Consumer Price Index (CPI) for all income households to base year 2018 from base year 2012 as announced in press release number 2022-01 dated 04 January 2022. The CPI series for all income households for January 2022 onwards will be 2018-based.
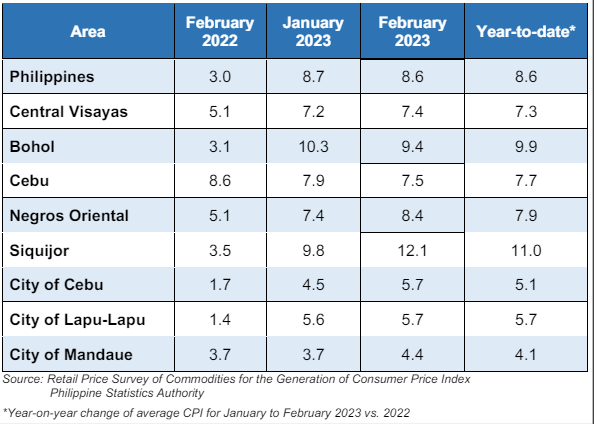
Table A. Year-on-Year Inflation Rates, All Items
In Percent
(2018=100)
Bohol
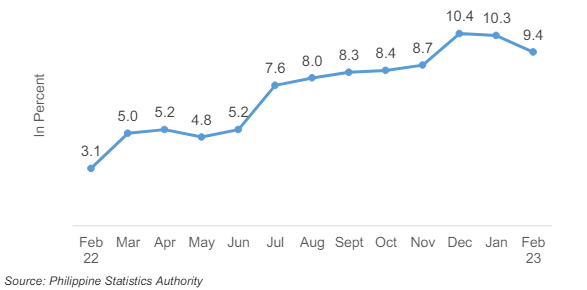
Inflation rate (IR) in Bohol continued to slightly decline, dropping to 9.4 from 10.3 in January 2023. The inflation rate in February 2022 was lower by 6.3 percent.
(Table A and Figure 1)
In comparison to national and regional figures, Bohol’s IR in February is higher by 0.8 percentage points than the national IR, and by 2.0 percentage points than the regional IR.
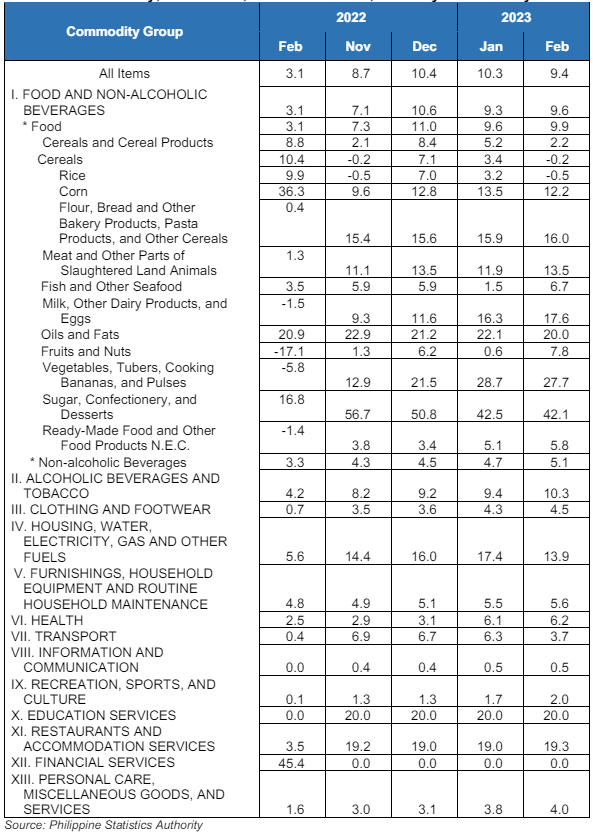
The double-digit annual increase in the index for Alcoholic Beverages and Tobacco at 10.3 percent and Restaurants and Accommodation Services at 19.3 percent contributed to the province’s IR. Also contributing to the uptrend were the following:
a. Food and non-alcoholic beverages at 9.6 percent;
b. Clothing and Footwear at 4.5 percent;
c. Furnishings, Household Equipment and Routine Household Maintenance at 5.6 percent;
d. Health at 6.2 percent;
e. Recreation, Sports, and Culture at 2.0 percent; and
f. Personal Care, Miscellaneous Goods and Services at 4.0 percent;
The commodity groups Information and Communication, Education Services, and Financial Services either retained its previous month’s IR or had zero percent annual growth.
Two commodities showed lower growth rates—Housing, Water, Electricity, Gas and Other Fuels went down to 13.9 from 17.4 percent; and Transport to 3.7 from 6.3 percent.
For Food index, it increased to 9.9 from 9.6 percent. In February 2022, Food index had a 3.1 percent IR.
Under Cereals and Cereal Products, which lowered to 2.2 from 5.2 percent, Cereals also went down to -0.2 from 3.4 percent, Rice down to -0.5 from 3.2 percent, and Corn down to 12.2 from 13.5 percent.
Double-digit IRs were identified in Flour, Bread and Other Bakery Products, Pasta Products, and Other Cereals at 16.0 percent; Meat and Other Parts of Slaughtered Land Animals at 13.5 percent; and Milk, Other Dairy Products, and Eggs at 17.6 percent. The following food groups also had higher annual increments during the month in comparison with the previous month:
a. Fish and Other Seafood from 1.5 to 6.7 percent;
b. Fruits and Nuts from 0.6 to 7.8 percent;
c. Ready-made Food and Other Food Products N.E.C. from 5.1 to 5.8 percent; and
d. Non-alcoholic Beverages from 4.7 to 5.1 percent.
Oils and Fats lowered to 20.0 from 22.1 percent; Vegetables, Tubers, Cooking Bananas, and Pulses to 27.7 from 28.7 percent; and Sugar, Confectionary, and Desserts to 42.1 from 42.5 percent.
Table B. Year-on-Year Inflation Rates in Bohol, All Items
In Percent
January 2019 – February 2023
(2018=100)
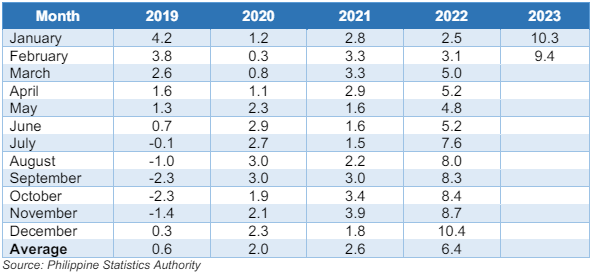
Table C. Inflation Rate by Commodity Group for All Income Households in Bohol: February, November, December 2022; January to February 2023
TECHNICAL NOTES
The Philippine Statistics Authority generates and announces the monthly Consumer Price Index (CPI) based on a nationwide survey of prices for a given basket of goods and services. Two important indicators, the inflation rate and purchasing power of the peso (PPP), are derived from the CPI which are important in monitoring price stability and the value of the country’s currency.
The CPI is an indicator of the change in the average retail prices of a fixed basket of goods and services commonly purchased by households relative to a base year.
Retail Price is the price at which a commodity is sold for spot in small quantities for consumption.
Base Period/Base Year is the period, usually a year, at which the index number is set to 100. It is the reference point of the index number series.
Market Basket is a term used to refer to a sample of goods and services that are commonly purchased and bought by an average Filipino household.
Weight is a value attached to a commodity or ground of commodities to indicate the relative importance of that commodity or group of commodities in the market basket.
Inflation Rate is equivalent to a decline in the purchasing power of the peso. It is the change in the CPI over a specific period of time (usually a month or a year). That is,
where:
CPI1 - is the CPI in the previous period
CPI2 - is the CPI in the current period
The Purchasing Power of the Peso (PPP) is a measure of the real value of the peso in a given period relative to a chosen reference period. It is computed by getting the reciprocal of the CPI and multiplying the result by 100. That is,
Headline Inflation is the rate of change in the weighted average prices of all goods and services in the CPI basket.
Prepared by:
FRED JORDAN MIKHAIL T. CARNICE (Sgd)
Information Systems Analyst I (COSW)
Reviewed by:
VENUS P. GLORIA (Sgd.)
Statistical Analyst
Approved by:
JESSAMYN ANNE C. ALCAZAREN (Sgd.)
Chief Statistical Specialist
PSA Bohol