March 2023 Inflation rate of Siquijor Province declines by 2.0 percent
1. Philippines
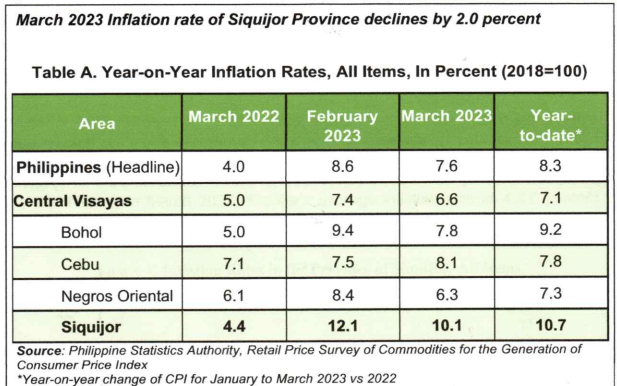
In March 2023, the headline inflation or the overall inflation in the Philippines slowed down further to 7.6 percent, from 8.6 percent in February 2023. This is lower by 1.0 percent from the previous month’s record. The average inflation rate for the first three months of 2023 stood at 8.3 percent. The Philippines’ average inflation in March 2022 was lower at 4.0 percent. (Table A)
The continued downtrend of inflation in March 2023 was mainly due to food and non-alcoholic beverages which recorded at 9.3 percent from the 10.8 percent inflation in February 2023. This was followed by transport with 5.3 percent inflation rate. Housing, water, electricity, gas, and other fuels was the third primary driver of the downtrend of inflation in the country at 7.6 percent from 8.6 percent.
2. Central Visayas
Following the trend at the national level, inflation in Central Visayas’ decelerated to 6.6 percent in March 2023 from 7.4 percent inflation in February 2023. This is lower by 0.8 percent from that of February’s record of inflation. The region’s average inflation in March 2022 was lower at 5.0 percent. The posted average inflation for the first quarter of 2023 in the region was at 7.1 percent.
Among provinces in March 2023, the Province of Siquijor still recorded the highest inflation at 10.1 percent followed by the Province of Cebu at 8.1 percent which also the only province that recorded an increase of inflation in the month. Meanwhile, the Province of Negros Oriental posted the lowest recorded inflation in the region for the month of March 2023 at 6.3 percent. (Table A)

3. Province of Siquijor
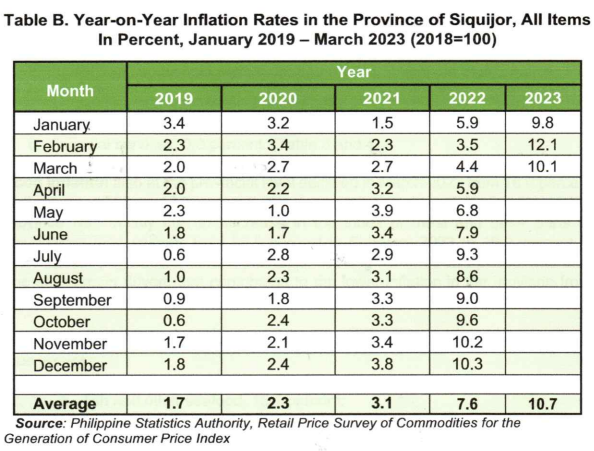
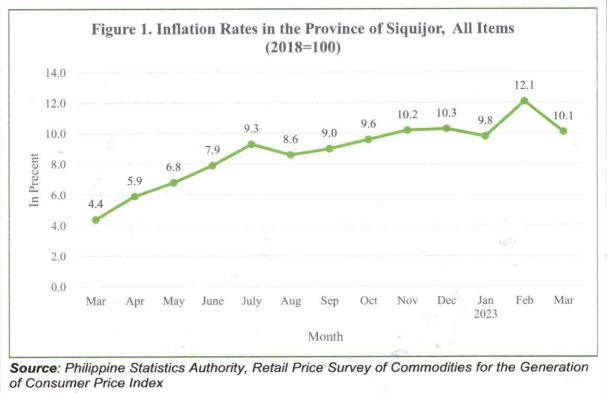
Just like the downtrend of inflation at the national and regional level in March 2023, the inflation at the province slowed down from 12.1 percent in February 2023 to 10.1 percent. This month’s rate of inflation decreased by 2.0 percent. The average inflation for the first quarter of 2023 at the province stood at 10.7 percent. Comparing to the inflation in March 2022, Siquijor’s average inflation was at 4.4.0 percent. (Table A & B and Figure 1)
The downslide of inflation in the province were mainly due to the lower annual rate in the index of food and non-alcoholic beverages from 15.6 percent in February 2023 to 12.7 percent in March 2023. This was followed by transport from 14.2 percent in February 2023 to 7.9 percent in March 2023. Restaurants and accommodation services as the third primary driver that mainly contributed to the downslide of inflation in the province moved from 26.4 percent in February 2023 to 25.0 percent in March 2023. (Table 3 and 4)
Moreover, indices of the following commodity groups in March 2023 slid down contributing to the lower overall inflation in the province:
a. housing, water, electricity, gas and other fuels, 5.4 percent;
b. alcoholic beverages and tobacco, 8.4 percent;
c. personal care, miscellaneous goods and services, 5.2 percent;
d. clothing and footwear, 9.5 percent; and
e. health, 3.5 percent. (Table 3 and 4)
On the contrary, recreation, sport and culture was the only commodity group that showed an increase of inflation from 3.7 percent in February 2023 to 4.0 percent in March 2023. (Table 3 and 4)
In addition, average inflation of the following commodity groups remained at its previous month’s record:
a. furnishings, household equipment and routine household maintenance, 17.6 percent;
b. information and communication, 0.0 percent;
c. education services, 3.9 percent;
d. financial services, 0.0 percent. (Table 3 and 4)
Food Inflation also at the provincial level declined in March 2023 from 16.0 percent in February 2023 to 12.8 percent. The lower inflation rate of food index of the province was mainly due to decrease in the index of meat and other parts of slaughtered land animals from 22.5 percent in February 2023 to 19.2 percent in March 2023. Vegetables, tubers, plantains, cooking bananas and pulses was also one of the main drivers that contributed to the lower inflation in the province from 26.1 percent in February 2023 to 19.0 percent in March 2023. (Table 5 & 9)
Meanwhile, lower annual growth rates of indices were also observed in the following food groups:
a. fish and other seafood, 16.1 percent;
b. fruits and nuts, 10.8 percent;
c. sugar, confectionary and desserts, 33.5 percent
d. Ready-made food and other food products n.e.c., 8.0 percent; and
e. Oils and fats, 11.6 percent. (Table 5 & 9)
On the other hand, index of milk, other dairy products and eggs posted an increase in inflation in March 2023 from 8.7 percent in February 2023 to 10.9 percent. (Table 5 & 9)
Cereals and cereal products food group also decline from the previous month’s record of 9.2 percent to 7.7 percent. Cereals declined from to 10.4 percent in February 2023 to 8.3 percent in March 2023 while flour, bread and other bakery products, pasta products, and other cereals inclined from 5.2 percent in February 2023 to 5.3 percent in March 2023. (Table 5 & 9)
For cereals food group, index for rice slowed in this month from 10.4 percent in February 2023 to 7.1 percent which was also the second primary driver of the downswing of food inflation at the provincial level while index for corn continued to rose further from 10.4 percent in February 2023 to 10.5 percent in March 2023. (Table 5 & 9)
TECHNICAL NOTES
Consumer Price Index (CPI)
The CPI is an indicator of the change in the average retail prices of a fixed basket of goods and services commonly purchased by households relative to a base year.
Uses of CPI
The CPI is most widely used in the calculation of the inflation rate and purchasing power of peso. It is a major statistical series used for economic analysis and as monitoring indicator of the government economic policy.
Measures the composite change in the consumer prices in various commodities overtime.
Computation of CPI
The computation of CPI involves consideration of the following important points:
a. Base Period – The reference date or base period is the benchmark or reference date or period at which the index is taken as equal to 100.
b. Market Basket – A sample of the thousands of varieties of goods purchased for consumption and the services availed by the households in the country selected to represent the composite price behavior of all goods and services purchased by consumers.
c. Weighting System – The weighting pattern uses the expenditures on various consumer items purchased by households as a proportion to total expenditure.
d. Formula – The formula used in computing the CPI is the weighted arithmetic mean of price relatives, the Laspeyre’s formula with a fixed base year period (2018) weights.
e. Geographic Coverage – CPI values are computed at the national, regional, and provincial levels, and or selected cities.
Inflation Rate
The inflation rate is the annual rate of change or the year-on-year change of CPI expressed in percent. Inflation is interpreted in terms of declining purchasing power of money.
***Statistical tables in excel file are provided as an attachment of this release.
(SGD.) JOSELITO C. MAGHANOY
(Supervising Statistical Specialist)
Officer-in-Charge