Siquijor CPI increases at 129.5
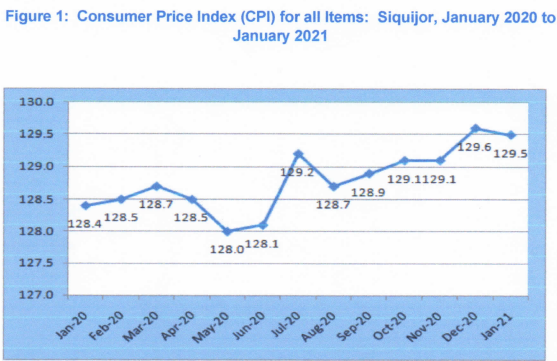
As of January 2021 the survey of retail prices of commodities conducted by Philippine Statistics Authority (PSA) in Siquijor Province has generated a CPI of 129.5 using 2012 as the base year. It has a slight decrease of -0.1 from December 2020 which posted a CPI of 129.6. During the same period in 2019, the CPI was at 128.4. The CPI for January 2021 period implied that the cost of a basket of goods and services commonly purchased by typical Filipino households in the Province of Siquijor was at an average of P129.5.
Price indices are used for economic analysis and as a monitoring indicator of government’s economic policy. CPI is most widely used in the calculation of the inflation rate and purchasing power of peso. It is an indicator of the changes in the average retail prices of a fixed basket of goods and services commonly purchased by Siquijodnons relative to the base year. Table 1 below shows the CPI result of Siquijor by commodity group.
Table 1. Consumer Price Index (CPI) by Commodity Group: Siquijor (2012=100)
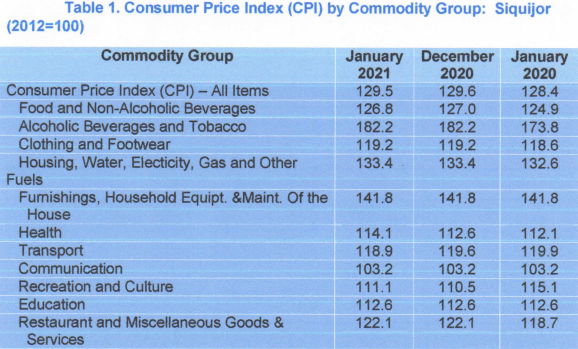
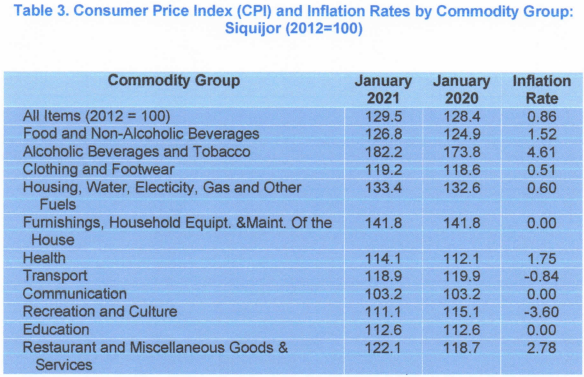
As shown in Table 1, commodities under Alcoholic Beverages and Tobacco remains with the highest CPI at 182.2 and followed the commodity group of Furnishings, Household Equipment and Maintenance of the House which recorded a CPI at 141.8. Housing, Electricity, Gas and other Fuels recorded at 133.4. The rest of the commodity groups had CPI lower than the provincial average of 129.5 for all items.
Figure 1 shows the graph of CPI for all items from January 2020 to January 2021.
Figure 1: Consumer Price Index (CPI) for all Items: Siquijor, January 2020 to January 2021
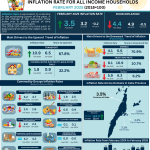
Siquijor Province Inflation lowered at 0.9% in January 2021
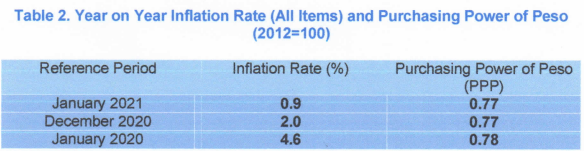
Siquijor inflation in January 2021 decreased to 0.9% from the previous month with inflation at 2.0%. From the same period in 2020 inflation was high at 4.6%. The purchasing power of peso in the province in January 2021 is at 77 centavos lower from last year of the same period at 78 centavos.
Inflation Rate is the rate of change of the CPI expressed in percent. Inflation is interpreted in terms of declining purchasing power of peso. See Table 2 for the year on year Inflation rate for all items.
Table 2. Year on Year Inflation Rate (All Items) and Purchasing Power of Peso (2012=100)
The decrease of inflation was mainly driven by most of the commodities that showed decrease in January 2021 from the same period last year (January 2020). Table 3 shows for the complete list of commodity group and its corresponding inflation rate.
Table 3. Consumer Price Index (CPI) and Inflation Rates by Commodity Group: Siquijor (2012=100)
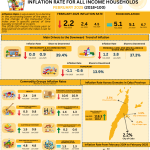
Consumer Price Index and Inflation Rates of Selected Food Items
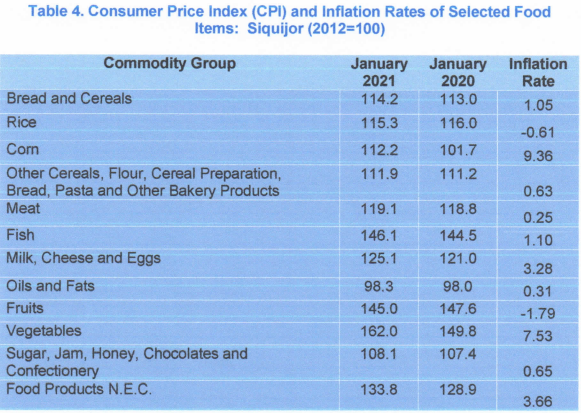
On the selected food items, highest inflation was recorded in Corn at 9.36% followed by Vegetables at 7.53%. Other food items with lower inflation are Food Products not elsewhere classified (3.66%), Milk, Cheese and Eggs (3.28%), Fish (1.10%), Bread and Cereals (1.05%), Sugar, Jam, Honey, Chocolates(0.65%), Other cereals (0.63%), Oils and Fats (0.31%) and Meat (0.25%). All other food groups with negative inflation in January 2021 are as follows:
· Rice (-0.61%)
· Fruits (-1.79%)
Table shows the complete list of inflation rates of selected food items for January 2021.
Table 4. Consumer Price Index (CPI) and Inflation Rates of Selected Food Items: Siquijor (2012=100)
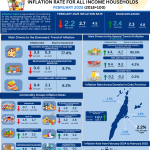
Purchasing Power of Peso (PPP) remains at 0.77
For the past 4 months, from October 2020 to January 2021 the purchasing power of peso in Siquijor Province remains at 0.77. It has a difference of 1 centavo from January 2020 with a PPP of 78 centavos. With the value of Php 1.0 in 2012, as the base year, PPP values only at Php 0.77 in January 2021.
Figure 2 shows the declining graph of purchasing power of peso from January 2020 to January 2021..
Figure 2: Purchasing Power of Peso (PPP): Siquijor, 2012 = Php 1.00
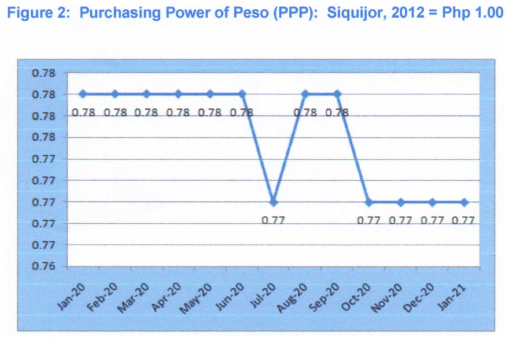
Purchasing Power of Peso (PPP) is computed as the reciprocal of the CPI for the specific multiplied by 100. The PPP is inversely related to inflation rate. Thus, as the inflation rate increases, PPP declines.
TECHNICAL NOTES
Uses of CPI
The CPI is most widely used in the calculation of the inflation rate and purchasing power of peso. It is a major statistical series used for economic analysis and as monitoring indicator of the government economic policy.
Computation of CPI
The computation of CPI involves consideration of the following important points:
a. Base Period – The reference date or base period is the benchmark or reference date or period at which the index is taken as equal to 100.
b. Market Basket – A sample of the thousands of varieties of goods purchased for consumption and the services availed by the households in the country selected to represent the composite price behavior of all goods and services purchased by consumers.
c. Weighting System – The weighting pattern uses the expenditures on various consumer items purchased by households as a proportion to total expenditure.
d. Formula – The formula used in computing the CPI is the weighted arithmetic mean of price relatives, the Laspeyre’s formula with a fixed base year period (2012) weights.
e. Geographic Coverage – CPI values are computed at the national, regional, and provincial levels, and or selected cities.
(SGD.) AURELIA M. CANDA
Chief Statistical Specialist