Starting February 2022, the Philippine Statistics Authority (PSA) released the rebased Consumer Price Index (CPI) for all income households to base year 2018, from base year 2012 as announced in the press release number 2022-01 dated 04 January 2022. The CPI series for all income households for January 2023 onwards will be 2018-based.
A. Philippines
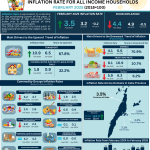
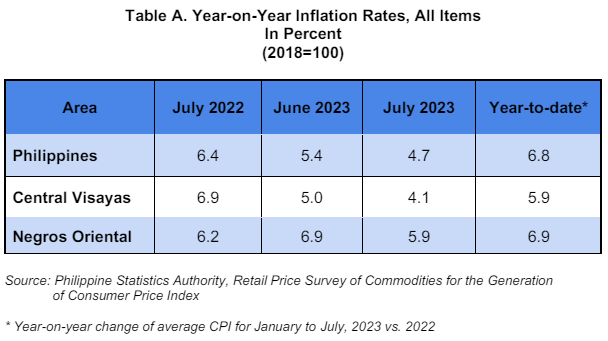
The country’s inflation rate slowed down further to 4.7 percent in July 2023 from 5.4 percent in June 2023. Despite the decline, the inflation rate in July 2022 was still higher at 6.4 percent. The year-to-date average inflation rate, that is from January to July 2023, stood at 6.8 percent. (Table A)
B. Central Visayas
Similar to the national trend, the Central Visayas's inflation rate slowed down further to 4.1 percent in July 2023 from 5.0 percent in June 2023. In July 2022, the inflation rate was higher at 6.9 percent. (Table A)
C. Province of Negros Oriental
1. Headline Inflation
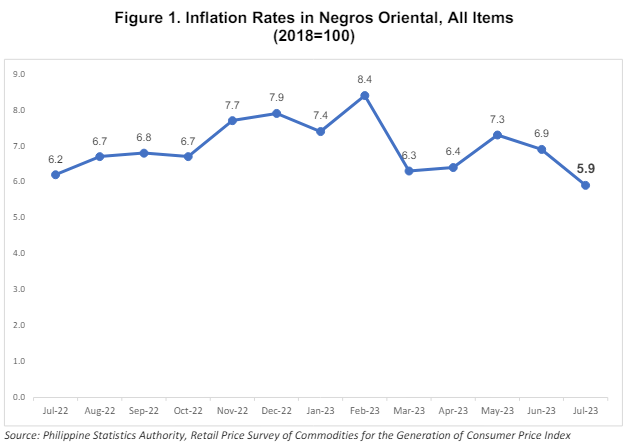
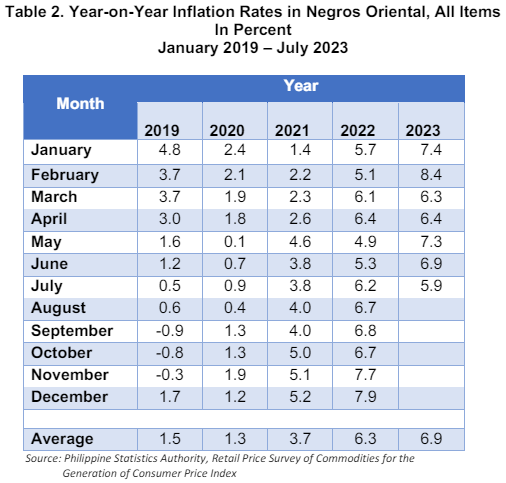
Headline inflation or the overall inflation in Negros Oriental has decreased to 5.9 percent in July 2023 from 6.9 percent in June 2023. The inflation rate in July 2022 was observed at 6.2 percent. This brings the average inflation rate from January to July 2023 to 6.9 percent. (Figure 1)
The province’s inflation rate was higher than the region’s inflation rate. (Table 1)
1.1 Main Drivers to the Downward Trend of the Headline Inflation
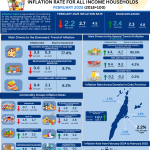
Among the 13 commodity groups, the downward trend of the overall inflation during the month was mainly brought about by Food and Non-Alcoholic Beverages recorded at 4.7 percent from 7.3 percent. Furnishings, Household Equipment and Routine Household Maintenance ranked second at 5.1 percent from 6.2 percent. Recreation, Sport and Culture was the third contributor at 4.0 percent from 5.0 percent. Health ranked fourth at 5.3 percent from 5.8 percent. Personal Care, and Miscellaneous Goods and Services ranked fifth at 4.3 percent from 4.5 percent. Clothing and Footwear ranked sixth at 7.1 percent from 7.2 percent. Followed by Transport at -8.1 percent from -7.3 percent in June 2023.
On the contrary, higher inflation rates were observed in the following commodity groups during the month:
a. Housing, Water, Electricity, Gas, and Other Fuels at 12.7 percent from 11.8 percent; and
b. Alcoholic Beverages and Tobacco at 13.6 percent from 13.2 percent.
On the other hand, four commodity groups have retained their previous month’s inflation rates and these were: Restaurants and Accommodation Services at 10.3 percent; Education Services at 2.2 percent; Information and Communication at 1.3 percent; Financial Services at 0.0 percent. (Table 3, Figure 2)
1.2 Main Contributors to the Provincial Inflation Rate
The top three commodity groups contributing to the July 2023 provincial inflation rate of 7.3 percent were the following:
a. Housing, Water, Electricity, Gas, and Other Fuels at 54.9 percent share or 3.2 percentage points;
b. Food and Non-Alcoholic Beverages with 31.1 percent share or 1.8 percentage points; and
c. Restaurants and Accommodation services at 8.6 percent share or 0.5 percentage point.
2. Food Inflation
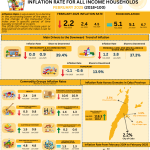
Food inflation at the provincial level slowed down further to 4.3 percent in July 2023 from 7.2 percent in June 2023. In July 2022, food inflation was lower at 9.1 percent. (Tables 6 and 7)
2.1 Main Drivers to the Downward Trend of Food Inflation
The deceleration of food inflation in July 2023 was primarily influenced by the annual decrease in Fruits and Nuts at -15.4 percent during the month from 2.7 percent in June 2023. This was followed by Fish and other seafood (ND) at 2.0 percent from 5.7 percent in the previous month. Also, contributing to the downtrend of food inflation in July 2023 was Cereals and cereals products (ND) at 3.6 percent from 4.7 percent in June 2023.
Sugar, Confectionery and Desserts was the fourth at 24.1 percent from 37.2 percent. Oils and fats, ranked second, recording a 22.8 percent inflation during the month from 34.1 percent in the previous month. Ready-Made Food and Other Food Products N.E.C., ranked third at 12.2 percent from 17.1 percent. Fish and Other Seafood ranked fourth at 2.0 percent from 5.7 percent. Next was the Milk, Other Dairy Products, and Eggs, 6.6 percent from 8.6 percent. Rice ranked sixth at 2.2 percent from 3.9 percent during the previous month. Flour, Bread and Other Bakery Products, Pasta Products, and other Cereals ranked seventh at 14.0 percent from 14.6 percent. Fruits and Nuts ranked next at -15.4 percent from 2.7 percent. Meat and Other Parts of Slaughtered Land Animals ranked ninth at -1.9 percent from 1.0 percent. This was followed by Corn with an annual increment of -2.1 from -1.8 percent in June 2023.
Lower inflation rates during the month were also observed in the indices of the following food items: (Table 5)
a. Flour, bread and other bakery products, pasta products, and other cereals, 14.0 percent from 14.6 percent;
b. Meat and other parts of slaughtered animals, -1.9 percent from 1.0 percent;
c. Milk, other dairy products and eggs (ND), 6.6 percent from 8.6 percent;
d. Oils and fats, 22.8 percent from 34.1 percent;
e. Sugar, confectionary and desserts, 24.1 percent from 37.2 percent; and
f. Ready-made food and other food products, 12.2 percent from 17.1 percent.
On the contrary, higher inflation rate was observed for Vegetables, Tubers, Plantains, Cooking Bananas and Pulses at 14.0 percent in July 2023 from 10.0 percent in the previous month.
2.2 Main Contributors to the Food Inflation
In terms of contribution to the July 2023 provincial inflation rate, food shared 0.33 percent or 4.3 percentage points. Of the food groups, the top contributors to inflation were the following:
The following food groups were the top contributors to food inflation during the month:
a. Cereals and cereal products, which include rice, corn, flour, bread, and other bakery products, with 34.1 percent share or 1.48 percentage points;
b. Vegetables, tubers, plantains, cooking bananas and pulses (ND) with 27.1 percent share or 1.16 percentage points; and
c. Sugar, confectionery, and desserts with 17.7 percent share or 0.76 percentage points.
APPROVED BY:
(SGD.) ARIEL T. FORTUITO
Chief Statistical Specialist