A. The Philippines
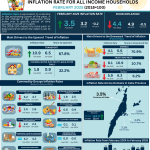
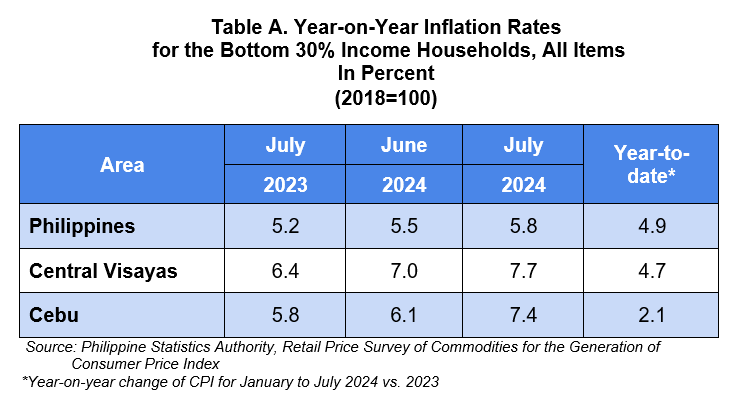
The country’s inflation rate for the bottom 30% income households increased to 5.8 percent in July 2024 from 5.5 percent in June 2024. This brings the average inflation for this income group from January to July 2024 to 4.9 percent. In July 2023, inflation rate was posted at 5.2 percent. (Table A)
B. Central Visayas
1. Regional Inflation
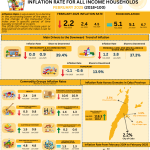
Following the trend at the national level, inflation rate for the bottom 30% income households in Central Visayas increased to 7.7 percent in July 2024 from 7.0 percent in June 2024. The region’s average inflation for this income group from January to July 2024 stood at 4.7 percent. In July 2023, the inflation rate in the region was lower which recorded at 6.4 percent. (Table A)
C. Province of Cebu
1. Headline Inflation
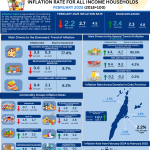
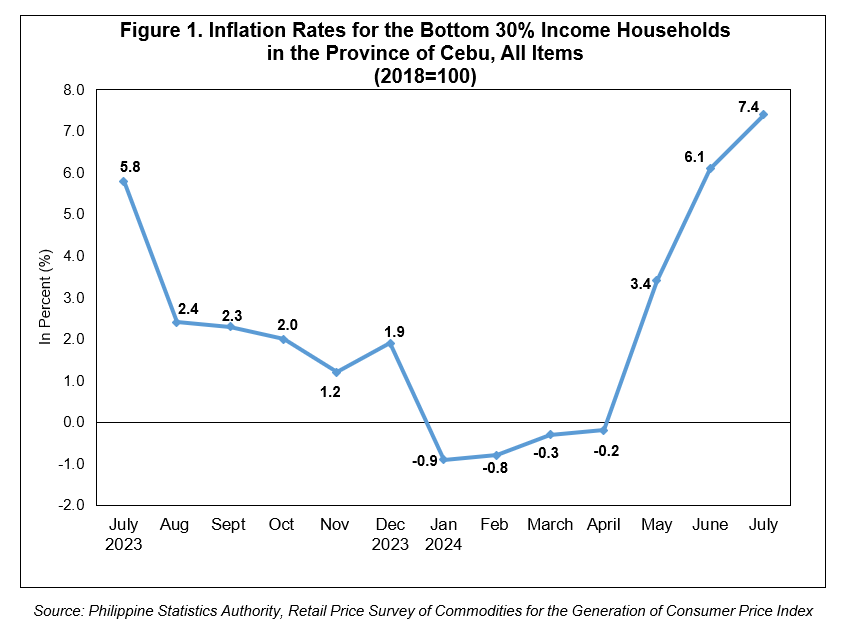
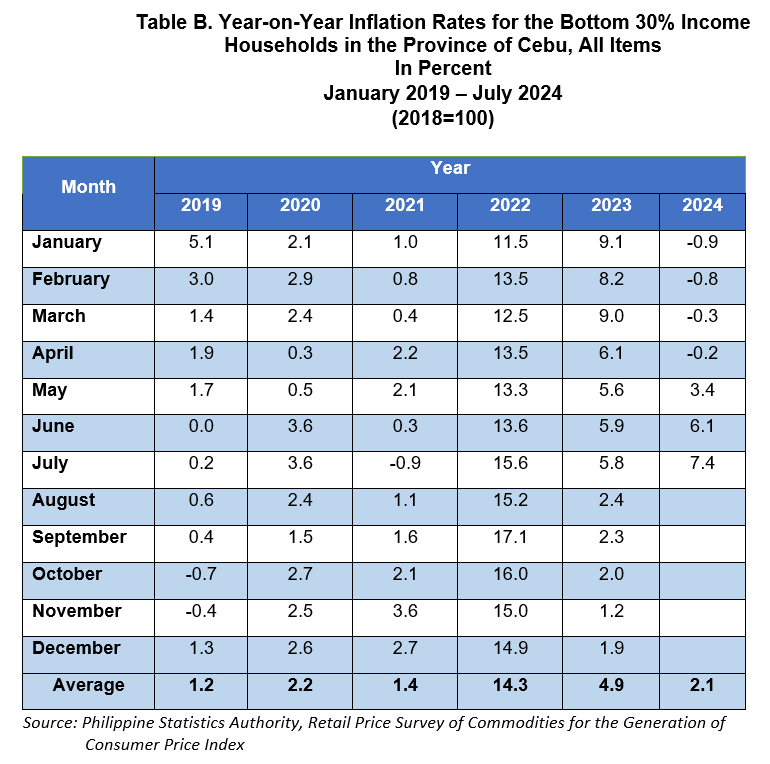
The headline inflation rate for the bottom 30% income households in the Province of Cebu increased to 7.4 percent in July 2024 from 6.1 percent in June 2024. This brings the province’s average inflation at 2.1 percent from January to July 2024. In July 2023, the inflation rate was recorded at 5.8 percent. (Table A and Figure 1)
1.1 Main Drivers to the Upward Trend of Headline Inflation in the Province of Cebu
The main driver to the upward trend of the headline inflation in July 2024 for bottom 30% income households was the faster year-on-year increase of heavily-weighted food and non-alcoholic beverages at 11.7 percent from 9.1 percent in June 2024. This was followed by housing, water, electricity, gas and other fuels at 3.9 percent from 3.6 percent in June 2024. Faster annual growth rate of health index also contributed to the uptrend inflation with 4.5 percent in July 2024 from 3.6 percent in June 2024. (Table 3)
In addition, faster annual increments were also noted in the indices of clothing and footwear at 1.1 percent, and furnishings, household equipment and routine household maintenance at 2.0 percent in July 2024 from their respective inflation rates at 0.8 percent and 1.7 percent in June 2024. (Table 3)
On the other hand, slower annual increases were posted in the indices of the following commodity group during the month:
a. Alcoholic beverages and tobacco, 4.7 percent from 5.1 percent;
b. Recreation, sport and culture, 4.8 percent from 4.9 percent; and
c. Personal care, and miscellaneous goods and services, 2.3 percent from 2.6 percent. (Table 3)
Transport commodity group recorded a faster annual decrease at 2.1 percent in July 2024 from no price movement in June 2024.
Indices of commodity groups that retained their previous month’s inflation were as follows:
a. Information and communication, 0.0 percent;
b. Education services, 0.2 percent;
c. Restaurants and accommodation services, 2.7 percent; and
d. Financial services, 0.0 percent. (Table 3)
1.2 Main Contributors to the Headline Inflation
The following commodity groups were the top contributors to the July 2024 overall inflation for the bottom 30% income households in the Province of Cebu:
a. Food and non-alcoholic beverages with 82.8 percent share or 6.1 percentage points.
b. Housing, water, electricity, gas and other fuels with 9.3 percent share or 0.7 percentage point; and
c. Restaurants and accommodation services with 3.6 percent share or 0.3 percentage point.
2. Food Inflation
Food inflation rate for the bottom 30% income households in the Province of Cebu increased to 12.3 percent in July 2024 from 9.5 percent in June 2024. In July 2023, food inflation stood at 5.6 percent. (Table 7)
2.1 Main Drivers to the Uptrend of Food Inflation
The main drivers to the uptrend of food inflation in July 2024 were mainly brought by the faster annual increases of the indices of corn at 31.8 percent, meat and other parts of slaughtered land animals at 9.6 percent, and fruits and nuts at 5.9 percent from their respective food inflation rates at 21.0 percent, 6.8 percent, and 3.1 percent in June 2024. (Table 5)
Slower annual decreases were recorded in the indices of fish and other seafoods at 7.3 percent, and sugar, confectionery and desserts at 7.2 percent during the month from their respective food inflation rates at 8.6 percent and 7.5 percent faster annual decreases in the previous month. (Table 5)
In contrast, lower inflation rates were recorded in the indices of the following food groups during the month:
a. Rice, 14.5 percent from 16.0 percent;
b. Flour, bread and other bakery products, pasta products, other cereals, 6.1 percent from 8.5 percent;
c. Milk, other dairy products and eggs, 2.9 percent from 3.5 percent;
d. Oils and fats, 0.5 percent from 1.1 percent;
e. Vegetables, tubers, plantains, cooking bananas and pulses, 16.4 percent from 20.0 percent; and
f. Ready-made food, and other food products not elsewhere classified, 10.2 percent from 12.1 percent. (Table 5)
2.2 Main Contributors to the Food Inflation
Food inflation contributed 80.9 percent share or 6.0 percentage points to the July 2024 overall inflation for this particular income group.
Among the food groups, the main contributors to the food inflation during the month were the following:
a. Cereals and cereal products, which includes rice, corn, flour, bread and other bakery products, pasta products, and other cereals, with 87.1 percent share or
10.7 percentage points;
b. Meat and other parts of slaughtered land animals with 9.8 percent share or
1.2 percentage points; and
c. Vegetables, tubers, plantains, cooking bananas and pulses with 9.4 percent share or 1.2 percentage points.
Approved by:
(SGD)MELCHOR B. BAUTISTA
Chief Statistical Specialist
KST/MLA