Starting February 2022, the Philippine Statistics Authority (PSA) released the rebased Consumer Price Index (CPI) for all income households to base year 2018, from base year 2012 as announced in the press release number 2022-01 dated 04 January 2022. The CPI series for all income households for January 2022 onwards will be 2018-based.
Table A. Year-on-Year Inflation Rates, All Items
In Percent
(2018=100)
A. The Philippines
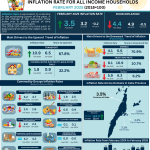
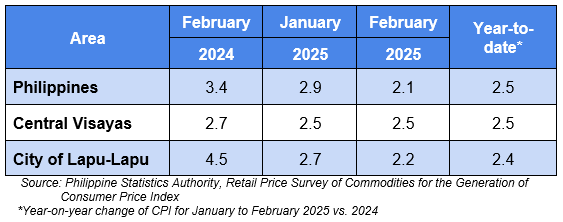
The Philippines’ headline inflation or overall inflation eased to 2.1 percent in February 2025 from 2.9 percent in January 2025. This brings the national average inflation from January to February 2025 to 2.5 percent. In February 2024, the inflation rate was higher at 3.4 percent. (Table A)
B. Central Visayas
1. Regional Inflation
In Central Visayas, the headline inflation or overall inflation in February 2025 remained at 2.5 percent, the same annual growth rate recorded in January 2025. The average inflation in Central Visayas from January to February 2025 posted at 2.5 percent. The inflation rate in February 2024 was higher which stood at 2.7 percent. (Table A)
C. City of Lapu-Lapu
1. Headline Inflation
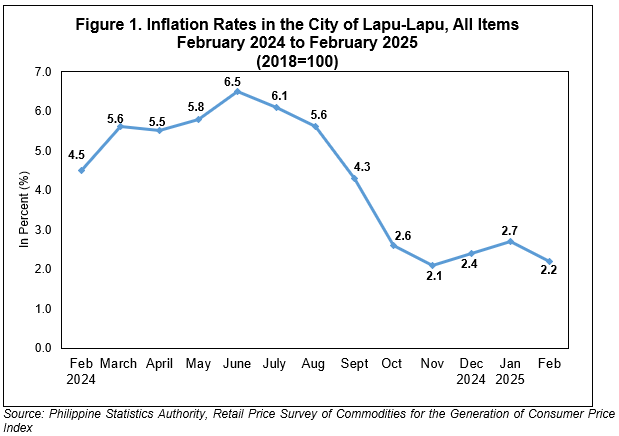
Lapu-Lapu City’s headline inflation posted a slower annual growth rate at 2.2 percent in February 2025 from 2.7 percent in January 2025. This brings the city’s average inflation from January to February 2025 to 2.4 percent. In February 2024, inflation rate stood at 4.5 percent. (Table A and Figure 1)
1.1 Main Drivers to the Downward Trend of the Headline Inflation
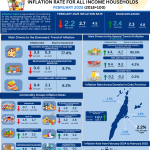
The downtrend of the headline inflation in February 2025 were primarily brought by the slower year-on-year increases of housing, water, electricity, gas and other fuels at 3.3 percent, restaurants and accommodation services at 0.6 percent, and clothing and footwear at 0.4 percent from their respective inflation rates at 5.3 percent, 1.1 percent, and 2.1 percent in the previous month. (Table 3)
Moreover, slower annual increments were also noted in the indices of transport at 0.7 percent, alcoholic beverages and tobacco at 1.5 percent, health at 1.5 percent, and recreation, sport and culture at 2.2 percent during the month from their respective inflation rates at 1.1 percent, 2.2 percent, 1.7 percent, and 2.6 percent in the previous month.
On the contrary, faster year-on-year increments were recorded in the indices of food and non-alcoholic beverages at 2.4 percent in February 2025 from 2.2 percent in January 2025 and personal care, and miscellaneous goods and services at 2.8 percent during the month from 2.2 percent in the previous month.
While, commodity groups that retained their previous month’s inflation rates were the following:
a. Furnishings, household equipment and routine household maintenance, 6.6 percent;
b. Information and communication, 0.1 percent;
d. Education services, 1.1 percent; and
e. Financial services, 0.0 percent.
1.2 Main Contributors to the Headline Inflation
The top three commodity groups that contributed to the February 2025 headline inflation were the following:
a. Food and non-alcoholic beverages with 38.8 percent share or 0.9 percentage point;
b. Housing, water, electricity, gas and other fuels with 37.5 percent share or 0.8 percentage point; and
c. Furnishings, household equipment and household routine maintenance with 7.5 percent share or 0.2 percentage point.
2. Food Inflation
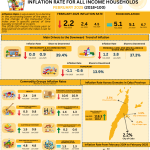
Food inflation in the city posted a faster annual growth rate at 2.4 percent in February 2025 from 2.3 percent in January 2025. In February 2024, food inflation was recorded at 4.8 percent. (Table 7)
2.1 Main Drivers to the Upward Trend of Food Inflation
The uptrend of food inflation in February 2025 were mainly brought by the faster annual increases in the indices of vegetables, tubers, plantains, cooking bananas and pulses at 4.4 percent and fish and other seafood at 9.4 percent from their respective inflation rates at 1.7 percent annual decline and 9.3 percent annual increase in the previous month. Slower annual decrement in oils and fats index at 0.2 percent in February 2025 from annual drop of 0.3 percent in January 2025 also contributed to the uptrend inflation in the city. In addition, corn index posted a faster annual increment at 5.8 percent during the month from 1.1 percent in the previous month. (Table 5)
On the contrary, slower annual increases were observed in the indices of flour, bread and other bakery products, pasta products, and other cereals at 0.6 percent, meat and other parts of slaughtered land animals at 2.8 percent, fruits and nuts at 6.9 percent, ready-made food and other food products not elsewhere classified at 3.9 percent during the month from their respective food inflation rates at 0.8 percent, 3.0 percent, 11.7 percent and 4.5 percent in the previous month.
Faster annual decrements were posted in the indices of rice at 2.9 percent, milk, other dairy products and eggs at 0.7 percent, and sugar, confectionery and desserts at 2.0 percent during the month from their respective food inflation rates at 2.0 percent annual drop, 0.6 percent annual decline, and 0.9 percent annual increase in the previous month.
2.2 Main Contributors to the Food Inflation
Food inflation shared 34.9 percent or 0.8 percentage point to the headline inflation in February 2025. Food groups with highest contribution to food inflation during the month were the following:
a. Fish and other seafood, with 68.3 percent share or 1.6 percentage points;
b. Meat and other parts of slaughtered land animals, with 24.5 percent share or 0.6 percentage point; and
c. Fruits and nuts, with 14.5 percent share or 0.4 percentage point.
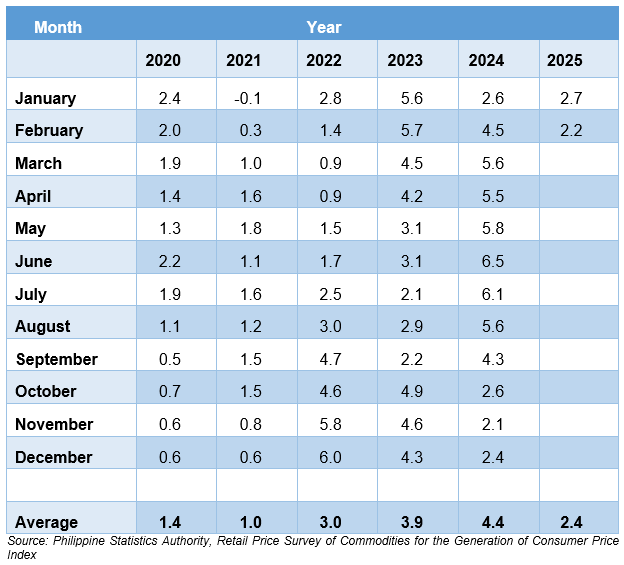
Table B. Year-on-Year Inflation Rates in the City of Lapu-Lapu, All Items
In Percent
January 2020 – February 2025
(2018=100)
Approved by:
MELCHOR B. BAUTISTA
Chief Statistical Specialist
MJG/KST