

Poverty incidence among Filipino families in Central Visayas in 2021 was estimated at 22.1 percent
Poverty incidence among Filipino families in Central Visayas in 2021 was estimated at 22.1 percent. This means that 22 out of 100 families have incomes below the amount needed to buy their basic food and non-food needs in 2021. An increase of 8.7 percentage points was recorded from the 2018 estimate at 13.4 percent and a decrease of 2.8 percentage points from 2015 which was recorded at 24.9 percent (Figure 1).
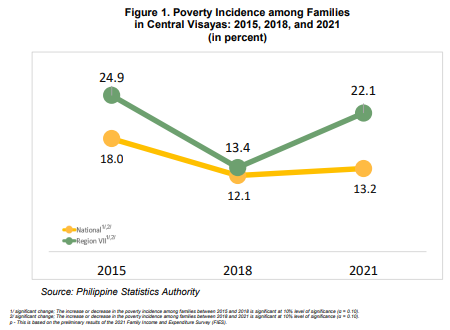
The poverty incidence among families in Central Visayas was observed to be higher than the national poverty incidence among families which was estimated at 13.2 percent in 2021, 12.1 percent in 2018, and 18.0 percent in 2015.
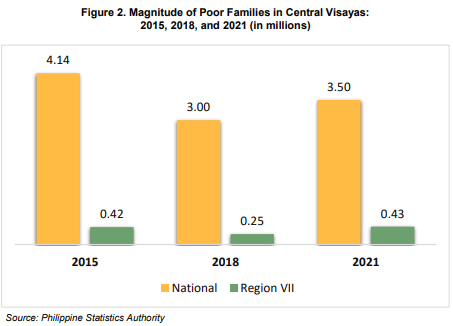
The number of poor Filipino families in Central Visayas in 2021
The number of poor Filipino families in Central Visayas in 2021 is estimated at 0.43 million (or 434 thousand) families. This was higher compared in 2018 which was estimated at 0.25 million (or 246 thousand) families and higher than the 0.42 million (or 423 thousand) families in 2015. (Figure 2)
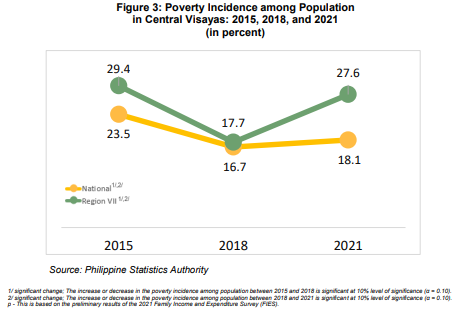
Poverty incidence among population in Central Visayas in 2021
Poverty incidence among population in Central Visayas in 2021 was estimated at 27.6 percent. This means that 27 out of 100 Filipinos whose incomes were below the amount needed to buy their basic food and non-food needs. This was estimated at 17.7 percent in 2018 and 29.4 percent in 2015.
The poverty incidence among the population in Central Visayas was observed to be higher than the national poverty incidence among population, which was estimated at 18.1 percent in 2021, 16.7 percent in 2018, and 23.5 percent in 2015. (Figure 3)
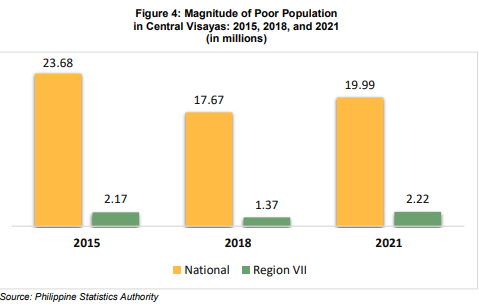
In 2021, about 2.22 million Filipinos in Central Visayas had incomes that fall below the poverty threshold. This was estimated at 1.37 million Filipinos in 2018 and 2.17 million Filipinos in 2015. (Figure 4)
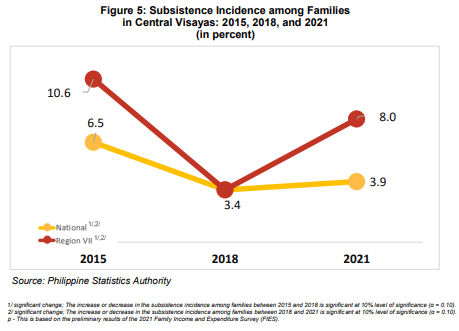
Subsistence incidence among Filipino families in Central Visayas
The subsistence incidence among Filipino families in Central Visayas was estimated at 8.0 percent in 2021. This means that 8 out of 100 Filipino families have incomes below the minimum amount needed to buy their basic food needs in 2021. In 2018, the proportion of families in Central Visayas who are food poor was recorded at 3.4 percent while it was recorded at 10.6 percent in 2015.
The subsistence incidence among families in Central Visayas was observed to be higher than the national subsistence incidence among families which was estimated at 3.9 percent in 2021 and 6.5 percent in 2015 but equal in 2018 which was estimated at 3.4 percent. (Figure 5)
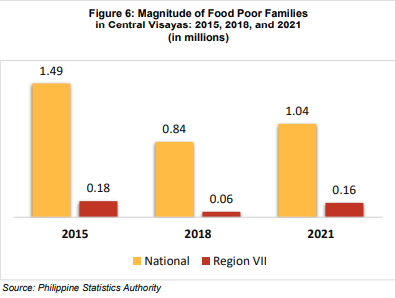
The 8.0 percent translates to about 0.16 million (or 157 thousand) families in Central Visayas that fall below the food threshold in 2021. In 2018, this was estimated at around 0.06 million (or 62 thousand) families and in 2015, this was estimated at around 0.18 million (or 180 thousand) families. (Figure 6)
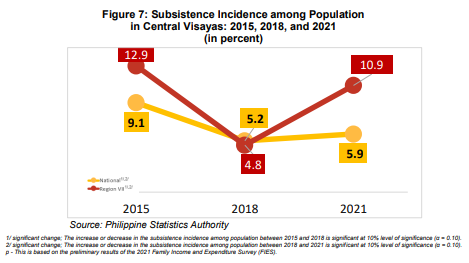
In 2021, the subsistence incidence among population in Central Visayas was estimated at 10.9 percent. This is 6.1 percentage points higher than the 4.8 percent estimate in 2018 but 2.0 percentage points lower in 2015 at 12.9 percent.
The subsistence incidence among population in Central Visayas was observed to be higher than the national subsistence incidence among population which was estimated at 5.9 percent in 2021 and 9.1 percent in 2015, but lower in 2018 which was estimated at 5.2 percent. (Figure 7)
There were 0.88 million or 876 thousand Filipinos considered as food poor in Central Visayas in 2021. (Figure 8)
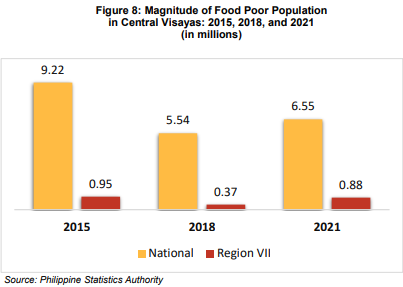
In 2018, food poor Filipinos was estimated at around 0.37 million (or 373 thousand), and in 2015, it was estimated at around 0.95 million (or 953 thousand).
Approved by:
(SGD.) ARIEL E. FLORENDO
Regional Director