Bohol
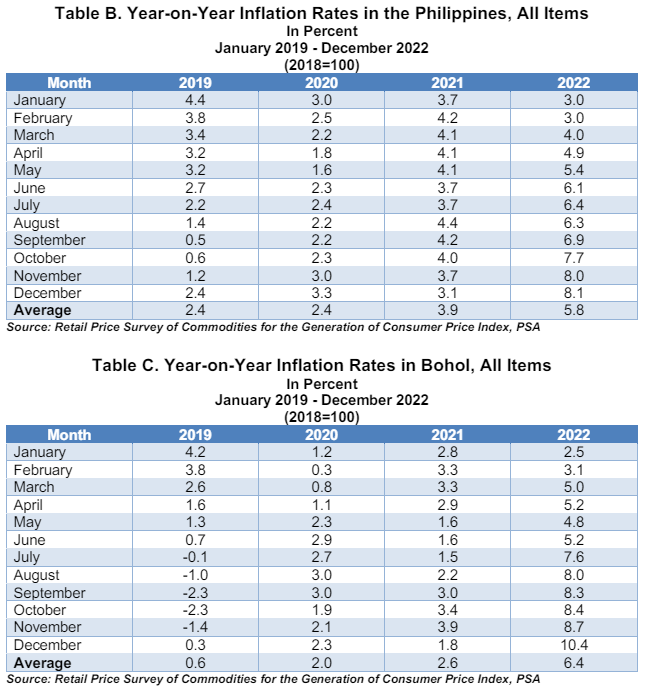
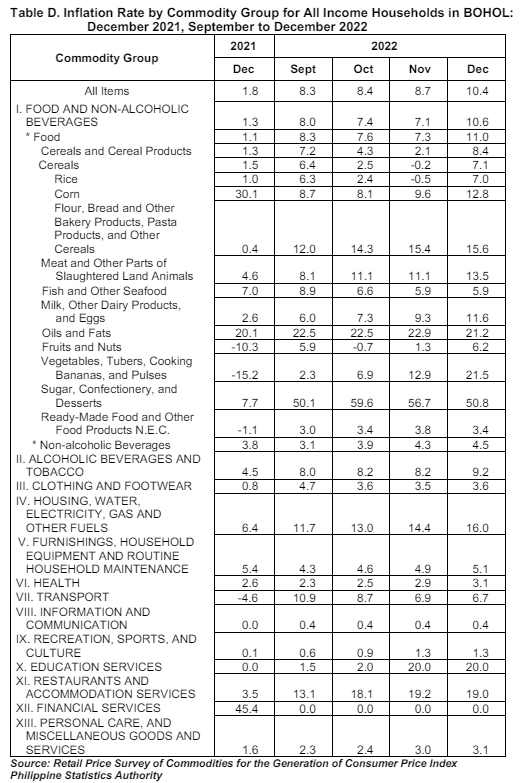
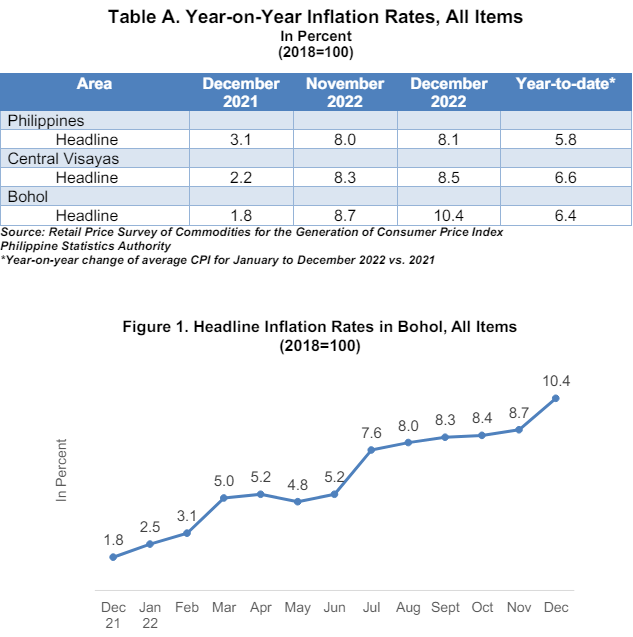
Inflation rate (IR) in Bohol continues to surge for the 7th consecutive month. It shot up to 10.4 percent in December 2022 from 8.7 percent in November 2022. This is again the peak of the trend since January 2019. Inflation rate in December 2021 was lower at 8.6 percent. The average inflation for the whole 12 months of 2022 stood at 6.4 percent. (Table A and Figure 1)
In comparison to national and regional figures, Bohol’s IR in December is higher by 2.3 percentage points than the national IR and by 1.9 percentage points than the regional IR.
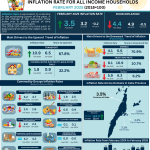
The increase in the province’s inflation was mainly brought about by the higher double-digit annual increase in the index for Food and Non-Alcoholic Beverages at 10.6; Housing, Water, Electricity, Gas and Other Fuels at 16.0 percent; and Education Services which maintained its record of 20.0 percent. Also contributing to the uptrend in the overall inflation during the period were the increments in the following commodities:
a. Alcoholic Beverages and Tobacco at 9.2 percent;
b. Clothing and Footwear at 3.6 percent;
c. Furnishings, Household Equipment and Routine Household Maintenance at 5.1 percent;
d. Health at 3.1 percent; and
e. Personal Care, Miscellaneous Goods and Services at 3.1 percent;
Commodity groups Information and Communication; Recreation, Sports, and Culture; and Financial Services, either retained their previous month’s inflation rates or had zero percent annual growths.
Two commodities showed lower growth rates—Transport went down to 6.7 from 6.9 percent; and Restaurants and Accommodation Services down to 19.0 from 19.2 percent.
For Food index, it showed a double-digit growth of 11.0 percent compared to the previous month’s 7.3 percent. In December 2021, Food index had a 1.1 percent inflation rate. Cereals rose to 7.1 from -0.2 percent.
Double-digit inflation rates were identified in Vegetables, Tubers, Cooking Bananas, Pulses at 21.5 percent; Flour, Bread and Other Bakery Products, Pasta Products, and Other Cereals at 15.6 percent; Meat and Other Parts of Slaughtered Land Animals at 13.5 percent; Corn at 12.8 percent; and Milk, Other Dairy Products, and Eggs at 11.6 percent. The following food groups also had higher annual increments during the month in comparison with the previous month:
a. Cereals and Cereal Products from 2.1 to 8.4 percent;
b. Rice from -0.5 to 7.0 percent;
c. Fruits and Nuts from 1.3 to 6.2 percent; and
d. Non-alcoholic Beverages from 4.3 to 4.5 percent.
Fish and Other Seafood retained the previous month’s growth rate of 5.9 percent. On the other hand, Oils and Fats lowered to 21.2 from 22.9 percent; Sugar, Confectionery, and Desserts to 50.8 from 56.7percent; and Ready-Made Food and Other Food Products N.E.C. to 3.4 from 3.8 percent.